Market Structure Shift Mapper
Wskaźnik
Wersja 1.0, Jul 2026
Windows, Mac
5.0
Opinie: 1
Trading product for Market Structure Shift Mapper Wskaźnik Key Levels MSS, image 2
Trading product for Market Structure Shift Mapper Wskaźnik Key Levels MSS, image 3
Trading product for Market Structure Shift Mapper Wskaźnik Key Levels MSS, image 4
Trading product for Market Structure Shift Mapper Wskaźnik Key Levels MSS, image 5
Trading product for Market Structure Shift Mapper Wskaźnik Key Levels MSS, image 6

Opis

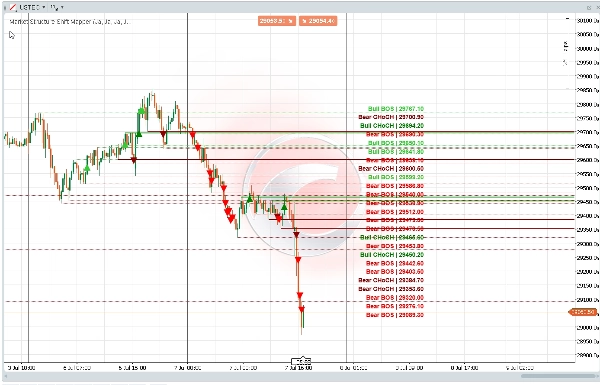
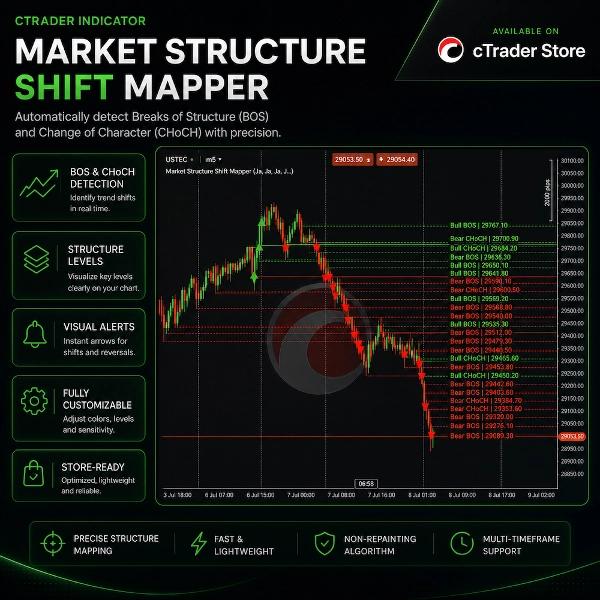
Market Structure Shift Mapper to wizualny wskaźnik cTrader zaprojektowany do identyfikacji przełamań struktury i zmian struktury rynku bezpośrednio na Twoim wykresie.


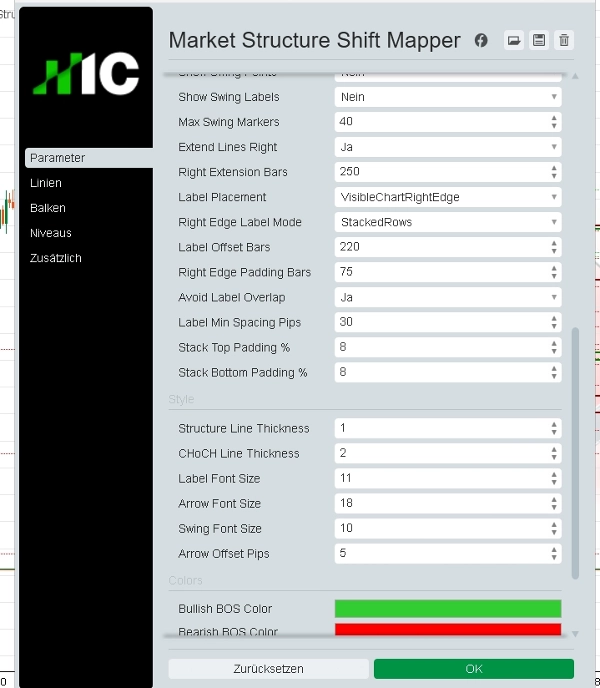
Wskaźnik wykrywa lokalne maksima i minima, a następnie oznacza bycze i niedźwiedzie zdarzenia BOS lub CHoCH, gdy cena przełamuje odpowiednie poziomy struktury. Może wyświetlać linie struktury, strzałki przełamań oraz czyste etykiety po prawej krawędzi z ułożeniem etykiet w stos, aby zmniejszyć wizualne nakładanie się.


Narzędzie zostało zaprojektowane do dyskrecjonalnej analizy ruchu cen, przeglądu struktury rynku, przygotowania wykresów opartych na płynności oraz badań backtestingu.


Główne cechy:

- Wykrywanie byczego BOS

- Wykrywanie niedźwiedziego BOS

- Wykrywanie byczego CHoCH

- Wykrywanie niedźwiedziego CHoCH

- Wykrywanie lokalnych maksimów i minimów

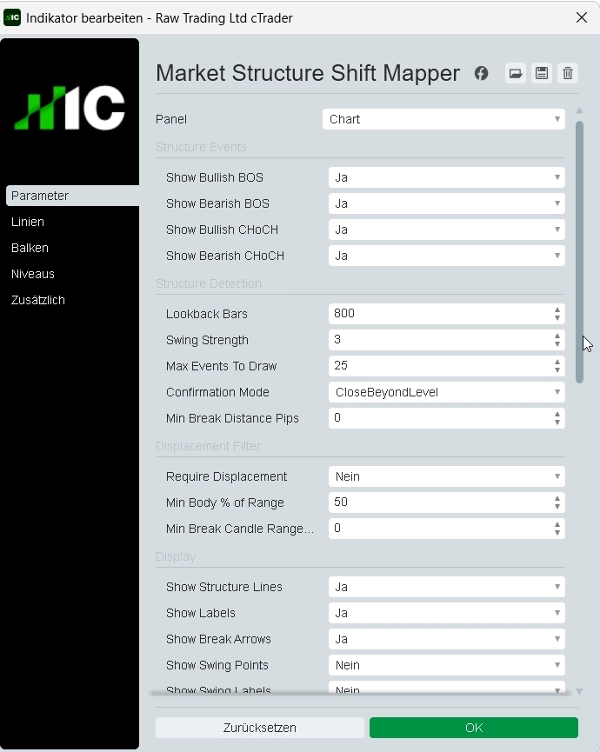
- Potwierdzenie oparte na zamknięciu lub knotach

- Opcjonalny filtr przesunięcia

- Strzałki przełamań struktury

- Linie poziomów struktury

- Opcjonalne markery punktów zwrotnych

- Etykiety ułożone w stos po prawej krawędzi

- Ochrona przed nakładaniem się etykiet

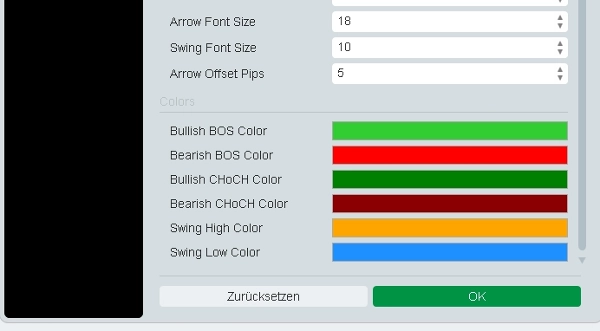
- Niestandardowe kolory i ustawienia linii

- Czysta nakładka na wykres

- Wskaźnik bezpieczny dla sklepu z ograniczonymi prawami dostępu


Market Structure Shift Mapper nie jest robotem handlowym. Nie wykonuje transakcji, nie modyfikuje zleceń ani nie zapewnia gwarantowanych sygnałów kupna/sprzedaży. Jest to wyłącznie narzędzie do wizualnej analizy i kontekstu rynkowego.


Handel wiąże się z ryzykiem. Ten wskaźnik nie udziela porad finansowych, rekomendacji inwestycyjnych, statystycznych prawdopodobieństw ani gwarantowanych wyników handlowych.

Podsumowanie

Podsumowanie AI
Market Structure Shift Mapper is a visual indicator for the cTrader platform that identifies and maps key market structure events directly on price charts. It detects swing highs and lows, then highlights bullish and bearish Break of Structure (BOS) and Change of Character (CHoCH) events when price breaks relevant levels. The indicator visually displays structure lines, break arrows, and right-edge stacked labels designed to minimize overlap for clearer chart interpretation.
Key features include:
- Detection of bullish and bearish BOS and CHoCH
- Swing high and low identification
- Close-based or wick-based confirmation options
- Optional displacement filtering
- Visual markers for structure breaks and swing points
- Customizable colors and line styles
- Clean chart overlay with label overlap protection
This tool supports discretionary price action analysis, market structure review, liquidity-based chart preparation, and backtesting research. It functions solely as a visual analysis aid and does not execute trades, modify orders, or provide trading signals or financial advice.
Profil wskaźnika
Kategoria wskaźnika
Struktura rynku (SMC)
Typ wyjścia
Wizualizacja
Wymagania dotyczące danych
Tylko słupki
Obsługiwane sygnały
Dotknięcie poziomu
Przebicie poziomu
Dywergencja
Siła trendu

Opinie klientów

5.0
Opinie: 1
5
100 %
4
0 %
3
0 %
2
0 %
1
0 %
Opinie klientów
July 19, 2026
Market Structure Shift Mapper is a clean, highly effective SMC tool for cTrader. It detects swing points and auto-labels BOS/CHoCH events. The label overlap protection keeps the chart readable, while the displacement filter and close/wick confirmations give excellent signal control. Though the last swing repaints until confirmed and alerts are missing, it’s a top-tier visual mapper for price action and liquidity-based trading.

Dyskusja

Częste pytania

Key Levels
MSS
BOS
CHOCH
Market Structure
Produkty dostępne za pośrednictwem cTrader Store, w tym boty handlowe, wskaźniki i wtyczki, dostarczane są przez deweloperów zewnętrznych i udostępniane wyłącznie w celach informacyjnych oraz w celu zapewnienia dostępu technicznego. cTrader Store nie jest brokerem i nie zapewnia doradztwa inwestycyjnego, nie udziela spersonalizowanych rekomendacji ani nie gwarantuje przyszłych wyników.

Więcej od tego autora

Wskaźnik
SMC
Prop
+6
Automatically draws the Opening Range (High & Low) for Tokyo, London, and New York sessions. Configurable start times,
Wskaźnik
Liquidity Grab
Liquidity Sweep
+2
Visualizes accumulation ranges, manipulation sweeps and distribution phases on your cTrader chart.
Wskaźnik
BOS
Key Levels
+2
Maps bullish and bearish order block zones, CE levels and structure-based price action context.
Wskaźnik
MSS
Key Levels
+4
Maps session ranges, previous highs/lows, equilibrium and premium/discount zones on your cTrader chart.
Wskaźnik
Key Levels
Liquidity Grab
+3
Visual market context dashboard showing bias states, CE positioning, session status and sweep context.
Wskaźnik
MSS
Key Levels
+2
Maps equal highs, equal lows and active liquidity pools directly on your cTrader chart.
Wskaźnik
EMA
RSI
+2
Compact premium cTrader dashboard for market bias, sessions, premium/discount context, liquidity direction, ADR range an
Wskaźnik
SMC
Prop
+12
Killzone, ICT, SMC, Session, Asia, London, New York, NY PM, Session High, Session Low, Smart Money, Order Flow, Trading
Wskaźnik
SMC
Prop
+12
Shows bullish/bearish bias for 5 timeframes in one panel. Three bias methods, alignment summary, fully configurable.

Możesz także polubić

Wskaźnik
Forex
Crypto
+3
MARainbow gives you the edge with four customizable moving averages—each color-coded for instant recognition.
Wskaźnik
AI
SMC
+9
Identifies market trends (-10 to +10) using HMA with volume confirmation. Includes customizable alerts.
Wskaźnik
VWAP
Volume
+2
VWAP Stdev Heatmap: Advanced daily VWAP with 5-tier standard deviation bands and dynamic candlestick coloring.
Wskaźnik
ATR
BTCUSD
+5
Trailing algo 📈 auto-tracks trends 🎯 adapts to volatility 🌟 precise moves 🛡️ retest signals 🚀 no lag, smart market
Wskaźnik
Visually master the Inside Bar strategy with clear breakout signals and professional chart highlighting 📈🔔📉
Wskaźnik
Forex
Fibonacci
+2
Enhance your trading with customizable alerts and dynamic visual tools for trendlines, Fibonacci levels, and more.
Wskaźnik
ATR
RSI
+5
Advanced Anchored VWAP for cTrader: volatility bands, real‑time alerts & customizable session resets.
Wskaźnik
AI
ATR
+25
On-chart draggable panel to show/hide Positions & Pending Orders with fixed warning banner and inline alerts per symbol.
Wskaźnik
ATR
Engulfing
+5
This indicator maps D1, H4, H1 and 15M Multi-Timeframe Bias and Fresh High Probability Supply and Demand zones
Wskaźnik
Grid
Prop
+14
Visualize trends with Standard Deviation Channel! Display median, and add customizable upper/lower deviation channels.
Wskaźnik
ATR
RSI
+6
Market structural patterns , specifically the concepts of Change of Character (ChoCH) 🔄 and Break of Structure (BoS) 💥
Wskaźnik
Forex
EURUSD
+4
Check the correlations between dozens of assets in one elegant display.
Wskaźnik
[Hamster-Coder] Pivot Points (Multi Time Frame)
Wskaźnik
VWAP
Volume
+3
Don't trust static support and resistance levels, this indicator combines Fibonacci and VWAP in one powerful tool.
Wskaźnik
Volume
Key Levels
+4
Session & Kill Zone Highlighter - Visual tool for London, NY, Tokyo, Sydney sessions plus ICT Kill Zones.
Wskaźnik
BOS
CHOCH
+2
The full SMC suite: structure BOS CHoCH MSS , FVG, liquidity, order blocks & a 0 to100 confluence score. No repaint.
Wskaźnik
Forex
Indices
+1
Professional Fair Value Gaps with multitimeframe spot on
Wskaźnik
ZLSMA: Zero-lag trend indicator! Catch trends fast with customizable settings. Boost your trading precision.

Cena