present
Зарегистрируйтесь и получите скидку $50 на первую покупку
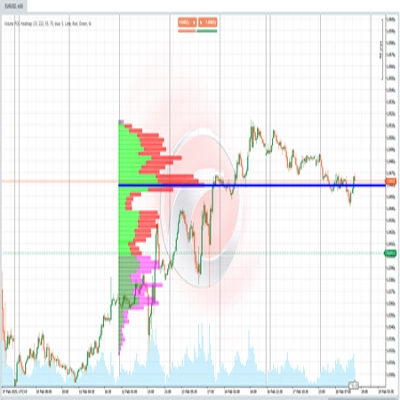
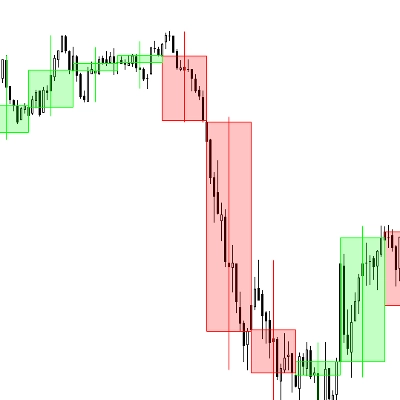
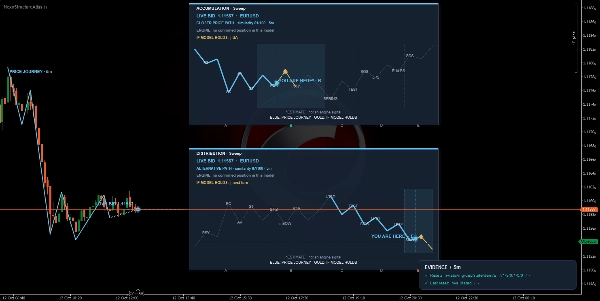
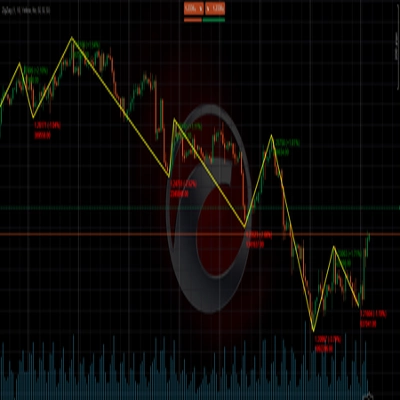
Trading product for NexoStructureAtlas Индикатор Key Levels MSS, image 1
NexoStructureAtlas
Индикатор
Версия 1.0, Oct 2026
Windows, Mac
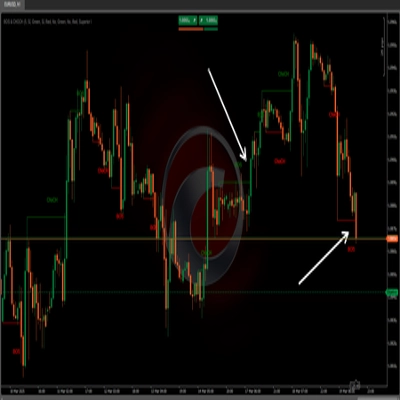
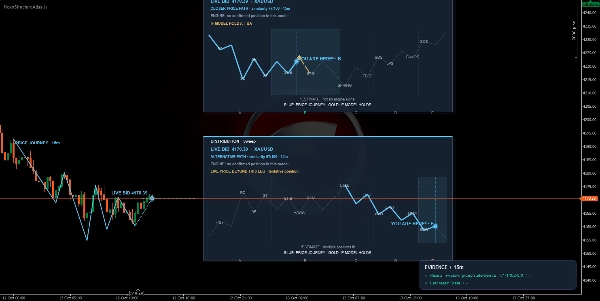
Trading product for NexoStructureAtlas Индикатор Key Levels MSS, image 2
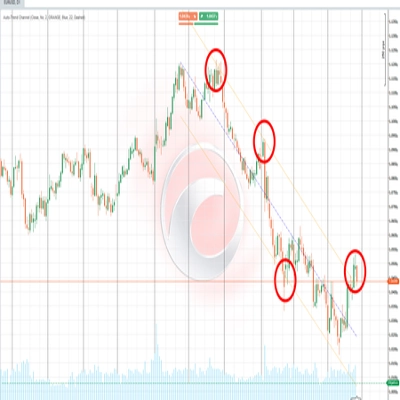
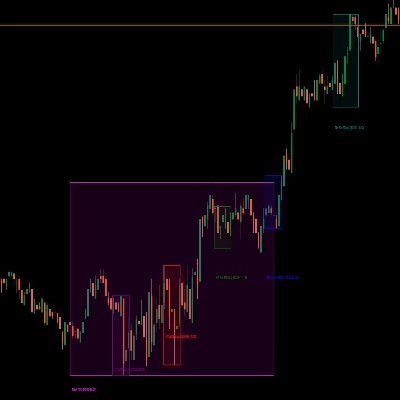
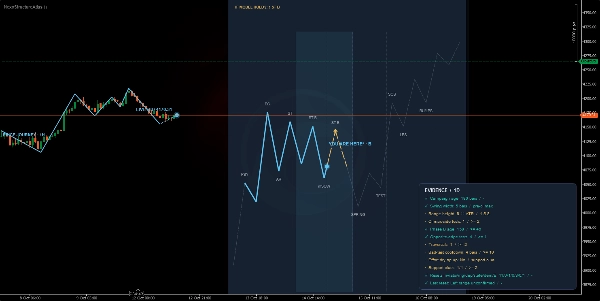
Trading product for NexoStructureAtlas Индикатор Key Levels MSS, image 3
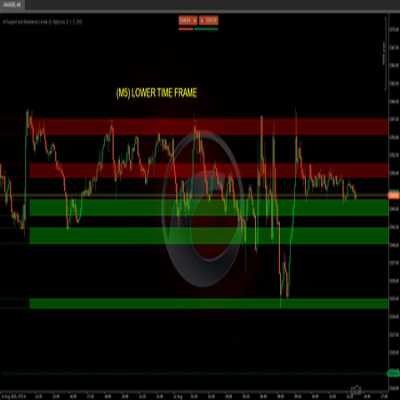
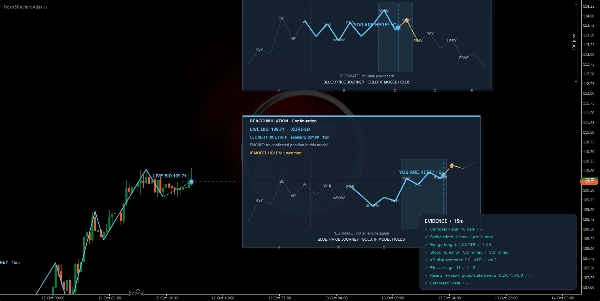
Trading product for NexoStructureAtlas Индикатор Key Levels MSS, image 4
Trading product for NexoStructureAtlas Индикатор Key Levels MSS, image 5
С 03/10/2024
177
Продажи
45.22K
Бесплатные установки

Описание

Nexo Structure Atlas is a professional-grade technical analysis tool designed for traders who operate based on market structure and institutional cycle dynamics. The indicator automates the identification of ranges, structural phases, and key turning points, projecting intuitive visual guides directly onto the chart.

📊 Market data and conditions analyzed

https://chartshots.spotware.com/c/6acd2589646ae

The indicator processes price action on both the current chart and higher timeframes. It analyzes:

  • Price ranges, ATR amplitudes, and swing widths (pivots).
  • Development and transition of accumulation, distribution, reaccumulation, and redistribution phases.
  • Stopping actions, terminal tests, and institutional support/resistance liquidity levels.

https://chartshots.spotware.com/c/6acd25cee9110

👁️ How to interpret visual elements and signals

https://chartshots.spotware.com/c/6acd260deee0e

  • Reference Cards: Optional overlapping panels showing ideal schemas of the current cycle (e.g., sweep or accumulation/distribution models), allowing you to visually compare where the price is within the theoretical model.
  • Price Journey Trace: Draws significant price movements and swings on the chart to clearly visualize trend structure and character changes.
  • Entry Badges: Visual markers on the chart signaling potential high-probability opportunities at key structural points (such as phase tests, support/resistance tests, and trend confirmations) according to the configured filtering policy.
  • Evidence and Summary Dashboard: A discreet informational panel detailing critical metrics of the current campaign: phase age, range height in ATR, validation status, and support metrics.

⚙️ Key settings and parameters

https://chartshots.spotware.com/c/6acd26ad835f3

The indicator offers extensive customization divided into groups accessible from cTrader:

  • Reference Atlas: Model selection (automatic or manual), number of visible reference cards, horizontal offset, and typography size.
  • Structure and History: Activation of live paths, higher timeframe historical analysis, and filtering by minimum phases.
  • Signals and Context: Entry qualification policies (Conservative, Standard, Aggressive) and selection of additional entry triggers.
  • Dashboard and Visual Identity: Full color customization (jade tones for demand, coral for supply, surface and text colors), range opacities, line thicknesses, and sound alerts for confirmed entries.

🎯 Use cases and trading scenarios

  • Institutional Range Identification: Ideal for detecting when an asset is building cause (accumulation/reaccumulation) or effect (distribution/redistribution).
  • Turning Point Trading: Using entry badges and phase tests to look for position entries favoring the main structural movement with defined risk management.

⚠️ Important limitations and usage notes

  • The indicator requires time-based charts (minutes, hours, days, weeks, or months).
  • It is an advanced technical analysis and decision-support tool; it does not constitute automated financial advice or guarantee profits on its own. Proper risk management and validation with your own operational strategy are recommended.

Сводка

Профиль индикатора
Категория индикатора
Структура рынка (SMC)
Тип вывода
Визуализация
Сигналы
Требования к данным
Только бары
Поддерживаемые сигналы
Прорыв
Разворот
Касание уровня
Прорыв уровня

Отзывы покупателей

0.0
Отзывы: 0
Отзывы покупателей
У этого продукта еще нет отзывов. Уже попробовали его? Поделитесь впечатлениями!

Обсуждение

Частые вопросы

Key Levels
MSS
CHOCH
Market Structure
ATR
Liquidity Grab
Support & Resistance
Продукты, доступные в cTrader Store, включая торговых ботов, индикаторы и плагины, предоставляются сторонними разработчиками и доступны исключительно в информационных и технических целях. cTrader Store не является брокером и не предоставляет инвестиционные консультации, персональные рекомендации или какие-либо гарантии будущей доходности.

Больше от этого автора

Логотип продукта "ZigZag"
Высокий рейтинг
4.3
(6)
Бесплатно
Индикатор
ATR
RSI
+7
ZigZag filters noise, spots trends, patterns, pivots, aiding analysis, trade management, and confirmations. 📉📈
Индикатор
ATR
RSI
+7
Identify bullish and bearish Order Blocks to spot key support/resistance levels and potential trend reversals! 📈🔄
Логотип продукта "Volume POC Heatmap"
Высокий рейтинг
5.0
(4)
Бесплатно
Индикатор
ATR
RSI
+7
📊 Shows volume by price levels, highlights POC, and key zones. Identifies dynamic support/resistance and imbalances.
Индикатор
ATR
RSI
+6
Market structural patterns , specifically the concepts of Change of Character (ChoCH) 🔄 and Break of Structure (BoS) 💥
Логотип продукта "Auto-Trend Channel"
Высокий рейтинг
4.4
(5)
Бесплатно
Индикатор
ATR
RSI
+6
Adaptive trend channel using linear regression and Pearson correlation for dynamic support, resistance, and trends.
Индикатор
RSI
Breakout
+1
"Identify key market zones and visualize support/resistance from multiple timeframes on a single chart.
Универсальный плагин
Economic Calendar
Displays live economic events directly inside your cTrader charts.
Индикатор
ATR
RSI
+6
💹 Define a price channel 📈 and determine trend direction (bullish 🟢 or bearish 🔴).
Индикатор
ATR
RSI
+7
identify and highlight temporary market inefficiencies known as "fair value gaps" 🚨 within specific trading Sessions.
Индикатор
RSI
BTCUSD
+5
Identify market structure effortlessly with swing highs, lows, CHoCH, and BOS levels for smart trading decisions! 📊🔍"
Индикатор
ATR
RSI
+6
📊Zones Supply & Demand: Identifies key price levels with high volume concentration, marking Supply/Demand Zones & Marke
Индикатор
Advanced price action tool that combines multiple technical analysis concepts

Вам также может понравиться

Индикатор
ATR
BOS
+5
Opening ranges, dynamic trend channels, and multi-scale breakout/retest analysis for clear intraday chart decisions.
Логотип продукта "Dot Momentum %BB Indicator"
Высокий рейтинг
4.2
(4)
$19
Индикатор
RSI
Signal
+2
Dynamic circles visualize price's volatility position. Like RSI for market overextension & stretch. Quantify context.
Логотип продукта "Vwap Bands"
Высокий рейтинг
4.5
(4)
$19
/
$29
Индикатор
VWAP
Moving Average
Vwap Bands it is highly sought after by professional traders because it includes Standard Deviation Bands
Индикатор
ADX
ATR
+2
GOLD SENTINEL v1.0 - A CANDLE-COLORING INDICATOR FOR GOLD.
Логотип продукта "SupertrendChannels"
Высокий рейтинг
4.7
(4)
$19
/
$20
Индикатор
Supertrend-based channel for entries, trailing stops, and dynamic support/resistance zones.
Логотип продукта "Session Kill-Zone Highlighter"
Высокий рейтинг
5.0
(4)
$19
Индикатор
Volume
Key Levels
+4
Session & Kill Zone Highlighter - Visual tool for London, NY, Tokyo, Sydney sessions plus ICT Kill Zones.
Индикатор
Forex
Multi-timeframe candlesticks!
Индикатор
Doji
Volume
+5
Instantly spot high-liquidity institutional moves with clean, non-obtrusive triangle alerts on cTrader charts.
Индикатор
RSI
MACD
Unlock market insights with our Multi-Timeframe Market Levels indicator, enhancing your trading strategies effortlessly
Индикатор
BOS
CHOCH
+5
BOS/CHoCH signals confirmed by liquidity sweep + FVG confluence, with a live conviction score.
Логотип продукта "ICT Killzones & Macros"
Высокий рейтинг
4.7
(4)
$20
/
$30
Индикатор
SMC
Prop
+8
KILLZONES AND MACRO SESSIONS
Индикатор
📊 Smart Floating Risk Pro – Advanced Risk Management for cTrader
Индикатор
ATR
Channel
+1
Bollinger Bands Advanced Squeeze & Breakout System, Real-Time On-Chart Dashboard, Auto-Squeeze Detector, Dual-Band Cloud
Индикатор
ATR
Forex
+3
LevelMaster S/R: Pinpoint key support & resistance zones with precision. Perfect for traders of all levels Trade smarter
Логотип продукта "Powells Key levels 4H Candle closures"
Высокий рейтинг
4.8
(5)
$25
Индикатор
VWAP
NAS100
+5
Key NY session opens for NASDAQ (US100) & SP500 to find Tick Precise Entrys for High R:R intraday setups.
Индикатор
ADX
ATR
+5
Configure, simulate, and analyze trading strategies with custom filters, multi-target exits, and detailed performance me
Индикатор
ATR
RSI
+8
Multi-timeframe market-state dashboard: Score (-100..+100) + UP/NEUT/DN per TF, with optional closed-candle arrows.
Логотип продукта "Zig-Zag Extremity Tracker"
Высокий рейтинг
4.6
(5)
$19
/
$30
Индикатор
RSI
Breakout
+1
Dynamically adjusts regression channels based on ZigZag extremes, resetting when price breaks bands to track real trends

Цена

С 03/10/2024
177
Продажи
45.22K
Бесплатные установки