
Açıklama
🚀 Kanal Kopuş Sistemi
Bu uzmanlaşmış algoritma, güvenilir sinyaller sağlamak için birden fazla teknik analiz öğesini birleştirerek giriş ve çıkış noktalarını kesinlikle doğrulamak üzere tasarlanmıştır 🎯.
🔍 Nasıl Çalışır?
📊 Volatilite Tabanlı Kanal (ATR)
✅ Piyasa volatilitesi ATR (Ortalama Gerçek Aralık) 📉 kullanılarak hesaplanır.
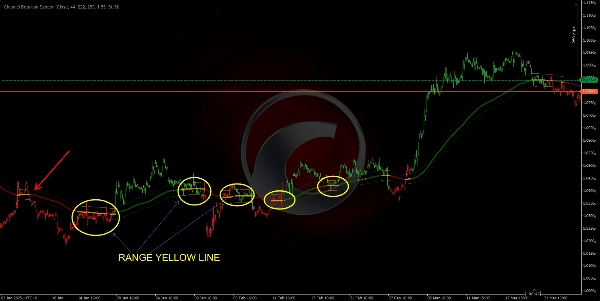
✅ "Trend MA", bu volatiliteye orantılı bir değer eklenip çıkarılarak ayarlanır ve piyasanın "tavan" ve "taban" işlevi gören iki noktalı çizgi oluşturur.
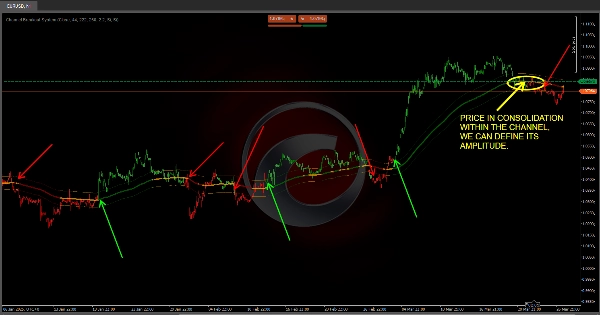
✅ Bu sizin için ne anlama geliyor? Fiyat kanal içinde kalıyorsa, piyasa yatayda ya da konsolidasyonda olabilir; net bir kopuş olursa, bu güçlü bir trend hareketi sinyalidir 📈📉.
✅ Tamamen özelleştirilebilir! Kanal ayarlarını stratejinize göre ayarlayın 📌.
🟢 Akıllı Renklerle Trend Tespiti
🔹 Gösterge, hızlı MA konumunu orta MA ile ve her ikisini de Trend MA ile karşılaştırır.
🔹 Piyasa aşamasına bağlı olarak, mumlar renk değiştirir:
- 🟢 Yeşil → Boğa piyasası aşaması.
- 🔴 Kırmızı → Ayı piyasası aşaması.
- 🟠 Turuncu veya nötr → Olası konsolidasyon veya belirsizlik.
🔹 Fiyat ve hareketli ortalamalar kanal içinde "sıkışmışsa", bu bir konsolidasyon aşaması sinyalidir ve kararsız bölgelerde işlem yapmaktan kaçınmanıza yardımcı olur.
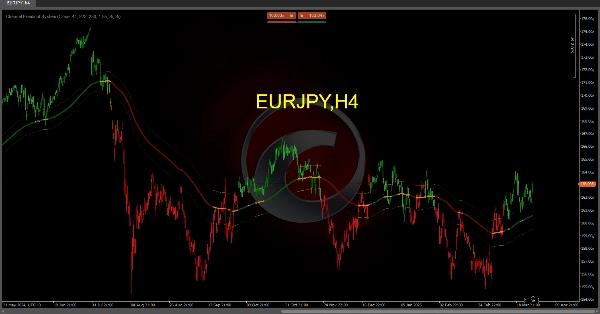
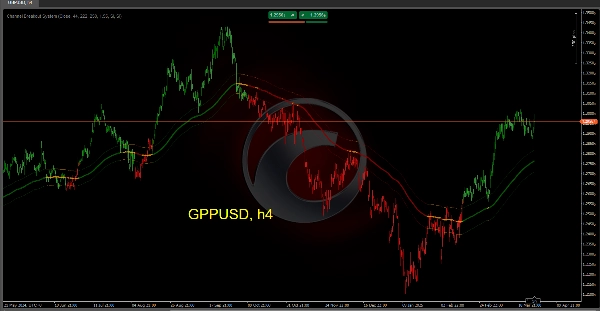
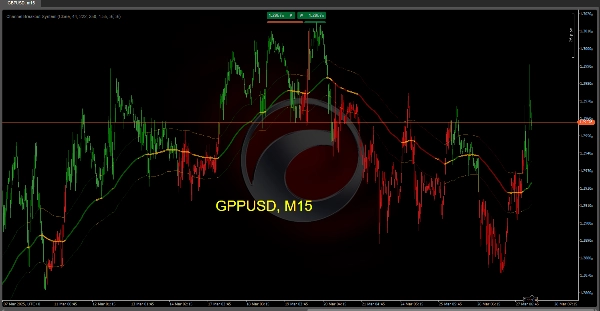
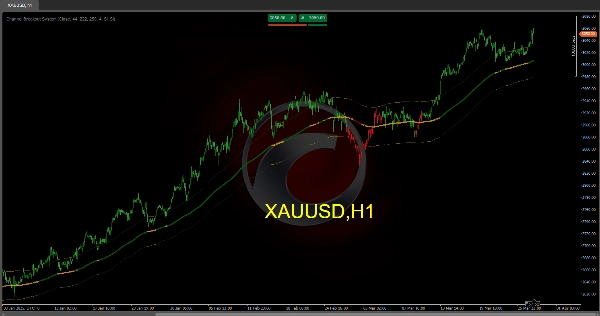
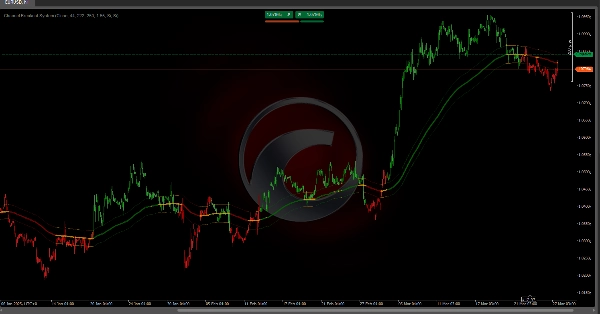
🎯 Grafikte Nasıl Görünür?
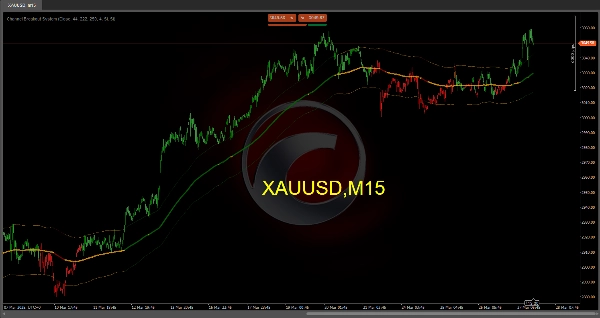
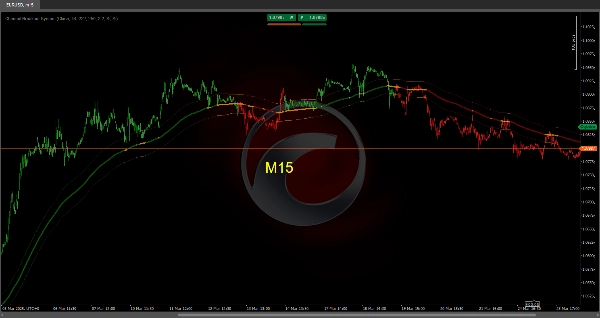
🔵 Ana trend çizgisi: Piyasa yönüne göre renk değiştirir (yeşil, kırmızı veya turuncu).
📏 Noktalı kanal: Volatiliteye dayalı piyasa aralığını yansıtır.
📊 Renkli çubuklar: Mevcut piyasa aşamasının kolay görsel temsilini sağlar.
🚀 Neden Bu Sistemi Kullanın?
✔ Piyasanın trendde mi yoksa yatayda mı olduğunu hızlıca belirler.
✔ Trend gücünü ve yönünü görsel olarak vurgular.
✔ Net kopuş ve kesişim sinyalleriyle potansiyel dönüşleri önceden tahmin eder.
✔ Giriş ve çıkış noktalarını doğrular, yanlış sinyalleri azaltır ve işlem doğruluğunu artırır.
🔹 Ticaretinizi optimize edin ve daha fazla güvenle işlem yapın Kanal Kopuş Sistemi 🏆 ile. En iyi piyasa fırsatlarını yakalamaya hazır olun! 📈🔥
Ctrader Store göstergeleri:
Dynamic Market Structure
Analysis of Turning Points
Fibonacci Linear
Regression Multi-timeframe
Multi-Level Candle Bias
Tracker
Auto Support and
Resistance Trend Lines
All Support and
Resistance Levels
Özet
The system features smart color-coded trend detection by comparing fast, medium, and trend MAs, with candles changing color to indicate market phases: green for bullish, red for bearish, and orange for consolidation or uncertainty. This visual aid helps identify trend strength, direction, and potential consolidation zones.
On the chart, the main trend line changes color based on market direction, the dotted channel reflects volatility-based range, and colored bars provide an easy visual representation of the current market phase.
The indicator is fully customizable to fit different trading strategies. It aims to quickly identify trending or ranging markets, anticipate potential reversals with breakout and crossover signals, and confirm entry and exit points to reduce false signals and improve trade accuracy.
Müşteri değerlendirmeleri
5 | 33 % | |
4 | 67 % | |
3 | 0 % | |
2 | 0 % | |
1 | 0 % |


