Beschreibung
Pinescriptlabs Store Indikatoren: Pinescriptlabs Store cBots : (cBot) Gold & BTC BreakoutSession Pivots(neu)
Erweiterte Marktstruktur: Bos, Choch, SwinLevels, Order Blocks, Marktstruktur & Liquiditätsfinder (Neu)
ZigZag Preis-Liquiditätsprojektion
Trailing Smart Algorithmus (neu)
Vorhersage basierend auf Linreg & ATR
SmartTrend Unterstützung &
Widerstand
Linien
Dynamische
Marktstruktur
Analyse
von
Wendepunkten
Punkten
Fibonacci
Lineare
Regression
Multi-Zeitrahmen
Mehrstufiger
Kerzen-Bias
Tracker
Reaktive gleitende Durchschnitt
Auto
Unterstützung und
Widerstand
Trend
Linien
Alle
Unterstützungs- und
Widerstandsniveaus
Levels
Zonen Angebot & Nachfrage
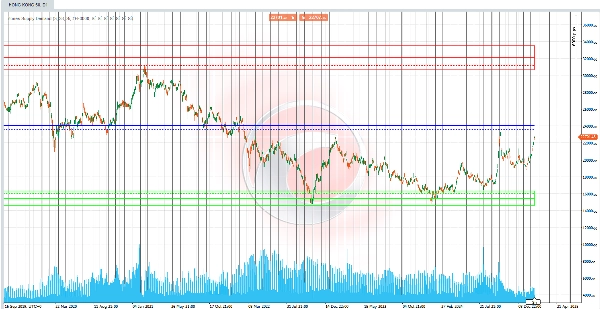
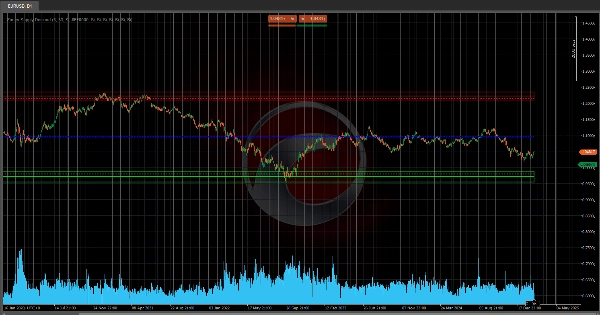
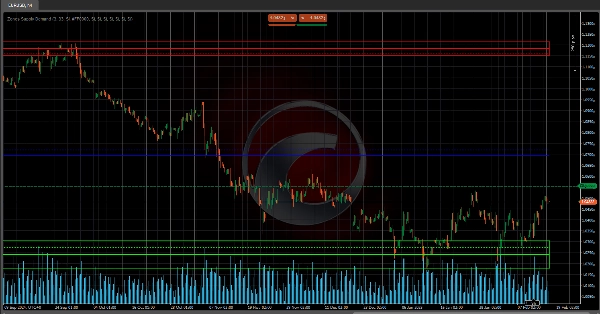
Der Algorithmus analysiert die Kursbewegung durch Volumenakkumulation, indem er den sichtbaren Kursbereich (vom Hoch zum Tief) in mehrere Segmente oder "Intervalle" unterteilt. 📏 Für jedes Intervall berechnet er das erzeugte Volumen und vergleicht es mit einem vordefinierten Schwellenwert-Prozentsatz. Das Ziel? Bereiche zu identifizieren, in denen die Volumenkonzentration so hoch ist, dass sie eine Angebotszone oder Nachfragezone signalisiert! 🎯
📉 Für die Angebotszone:
- Beginnen Sie beim höchsten Preis und bewegen Sie sich nach unten durch die Intervalle.
- Sammeln Sie das Volumen in jedem Segment an.
- Wenn das akkumulierte Volumen den Schwellenwert überschreitet, markiert es eine Angebotszone 🚨.
- Ein farbiger Bereich (Rechteck mit bestimmter Transparenz) wird von diesem Niveau bis zum Hoch gezeichnet, zusammen mit horizontalen Linien, die einfache & gewichtete Durchschnitte der Preise in dieser Zone anzeigen. 🖍️
📈 Für die Nachfragezone:
- Beginnen Sie beim niedrigsten Preis und bewegen Sie sich nach oben durch die Intervalle.
- Sammeln Sie das Volumen in jedem Segment an.
- Wenn das akkumulierte Volumen den Schwellenwert überschreitet, definiert es eine Nachfragezone 🚨.
- Ein entsprechender Bereich wird gezeichnet, zusammen mit Durchschnittslinien, um das mittlere Konzentrationsniveau hervorzuheben. 🖌️
⚖️ Marktgleichgewicht:
Wenn sowohl Angebots- als auch Nachfragezonen identifiziert sind, berechnet der Algorithmus einen Marktgleichgewichtspunkt! 🌟 Dieses Gleichgewicht wird aus dem Durchschnitt (einfach oder volumen-gewichtet) zwischen den beiden Zonen abgeleitet. Das Ergebnis? Klare Referenzlinien im Chart, die das Gleichgewicht zwischen Kauf- und Verkaufsdruck anzeigen! ⚖️✨
✅ Zusammenfassung:
Der Indikator "Zonen Angebot & Nachfrage" verwendet volumenbasierte Preis-Segmentierung zur Erkennung wichtiger Bereiche der Auftragskonzentration. 🗝️ Er erzeugt dann visuelle Hinweise (farbige Zonen, Durchschnittslinien und Gleichgewichtspunkte), um kritische Niveaus im Chart hervorzuheben und Händlern zu ermöglichen, Angebots-Nachfrage-Ungleichgewichte und potenzielle Wendepunkte zu erkennen! 🚀💡
Zusammenfassung
Kundenbewertungen
5 | 0 % | |
4 | 50 % | |
3 | 50 % | |
2 | 0 % | |
1 | 0 % |