
Supertrend - Multi-Timeframe
Indicador
1 compras
Versión 1.0, Oct 2025
Windows, Mac
4.5
Valoraciones: 2
Descripción
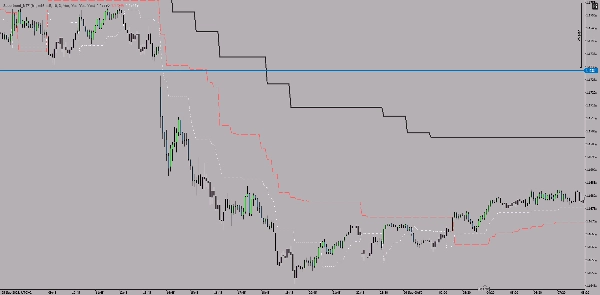
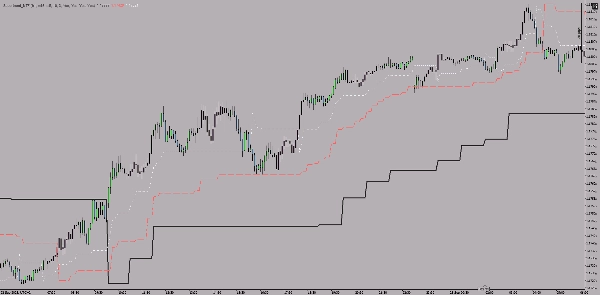
Este es un indicador Supertrend Multi-TimeFrame para la plataforma cTrader que muestra líneas Supertrend de tres marcos temporales diferentes simultáneamente en un solo gráfico.
Características clave
Visualización de tres marcos temporales paralelos:
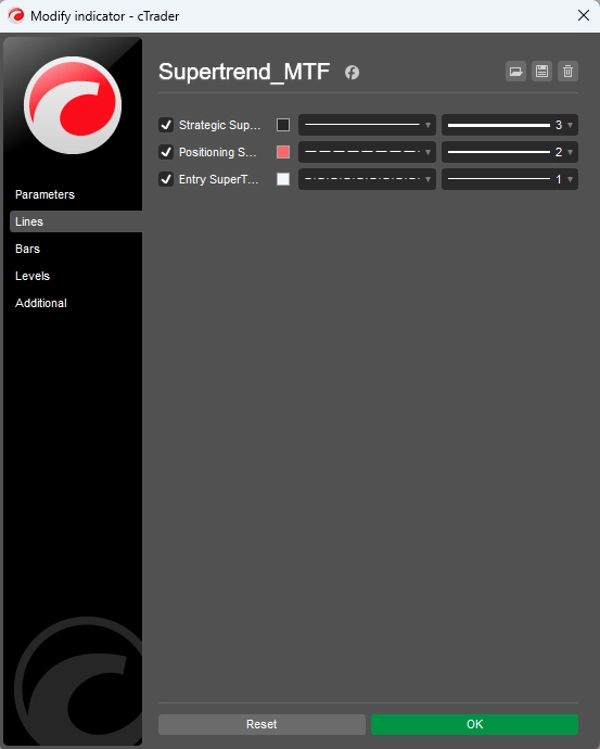
- Marco temporal estratégico (predeterminado: 1 hora) - línea gruesa y sólida
- Marco temporal de posicionamiento (predeterminado: 15 minutos) - línea de grosor medio y punteada
- Marco temporal de entrada (predeterminado: 5 minutos) - línea delgada y punteada
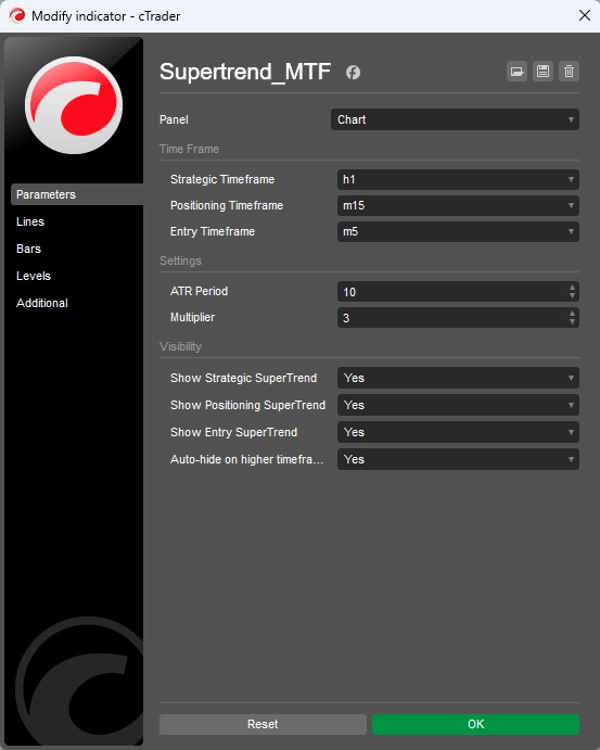
Configuraciones personalizables:
- Período ATR (predeterminado: 10)
- Multiplicador (predeterminado: 3.0)
- Cada uno de los tres marcos temporales puede activarse/desactivarse individualmente
- Ocultación automática en marcos temporales superiores (opcional)
Cómo funciona
El indicador utiliza la lógica clásica de Supertrend para los tres marcos temporales, donde:
- La tendencia es alcista cuando el precio está por encima de la línea Supertrend
- La tendencia es bajista cuando el precio está por debajo de la línea Supertrend
- Diferentes grosores y estilos de línea ayudan a distinguir entre marcos temporales
Propósito
Ayuda en el análisis multitemporal: el marco temporal más grande proporciona la dirección principal (estrategia), el intermedio refina el posicionamiento y el más pequeño marca puntos específicos de entrada.
Resumen
Resumen de IA
The Supertrend - Multi-Timeframe Indicator for the cTrader platform displays Supertrend lines from three distinct timeframes simultaneously on a single chart. It features a strategic timeframe (default 1 hour) shown as a thick solid line, a positioning timeframe (default 15 minutes) as a medium dashed line, and an entry timeframe (default 5 minutes) as a thin dotted line. Each timeframe can be individually enabled or disabled, with customizable settings including ATR period and multiplier. The indicator applies classic Supertrend logic: the trend is considered up when the price is above the Supertrend line and down when below. Different line styles and thicknesses visually distinguish the timeframes. This tool supports multi-timeframe analysis by providing the main directional trend from the larger timeframe, refined positioning from the middle timeframe, and specific entry points from the smallest timeframe. It is applicable across various markets including Forex, indices, commodities, stocks, and cryptocurrencies, and supports symbols such as BTCUSD, EURUSD, GBPUSD, XAUUSD, NAS100, and USDJPY.
Perfil del indicador
Valoraciones de clientes
4.5
Valoraciones: 2
5 | 50 % | |
4 | 50 % | |
3 | 0 % | |
2 | 0 % | |
1 | 0 % |
Valoraciones de clientes
October 13, 2025
The part worth keeping is the setup needs a cleaner reason to exist, and a few ugly trades are useful in the sample.
October 10, 2025
Conversación
Preguntas frecuentes
BTCUSD
Forex
Breakout
Indices
EURUSD
Commodities
GBPUSD
NZDUSD
Prop
Scalping
Crypto
Stocks
XAUUSD
NAS100
USDJPY
Los productos disponibles a través de cTrader Store, incluidos bots, indicadores y plugins para operar, son proporcionados por desarrolladores de terceros y están disponibles únicamente con fines informativos y de acceso técnico. cTrader Store no es un bróker, por lo que no proporciona asesoramiento de inversión, recomendaciones personales ni ninguna garantía de rentabilidad futura.


![Logotipo de "Gaussian Channel [Iridio Capital]"](https://cdn.ctrader.com/image/webp/7c039209-5573-4a54-a072-f9528b503103_41960)


Precio
Desde 05/01/2025
14
Ventas