
Descripción
La mejor manera de pensar en el Índice Compuesto tal como se aplica al RSI es pensar en el RSI como Windows 3.0 y en el Índice Compuesto como Windows 10. Constance Brown descubrió que el RSI, aunque crea y detecta divergencias, no es tan preciso como podría ser. Es un poco un oxímoron decir esto, pero el RSI es un indicador de momentum sin ningún cálculo de momentum adjunto. El RSI pierde una cantidad significativa de movimientos importantes e incluso genera algunos movimientos erróneos. Lo que hizo Constance Brown con el RSI fue introducir un cálculo de momentum dentro del propio RSI. Este índice elimina las restricciones del rango de normalización en el RSI. Esto significa que no está limitado dentro del rango de 0-100.
El RSI y el Índice Compuesto Juntos
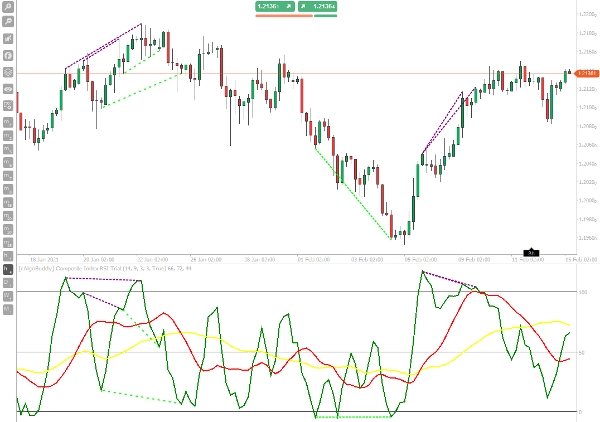
Una de las estrategias que Constance Brown empleó con el Índice Compuesto fue comparar el Índice Compuesto contra el RSI. Cuando buscamos divergencias, buscamos cosas como la divergencia alcista. Una divergencia alcista ocurre cuando el precio crea máximos más altos, pero el oscilador muestra máximos más bajos. Cuando usamos el RSI y el Índice Compuesto juntos, tratamos el RSI como trataríamos un gráfico de precios y el Índice Compuesto es el oscilador.
El indicador tiene una línea interna normal de RSI para detectar divergencias, así que el trabajo ya está hecho para ti. Opera las señales de divergencia como lo harías con cualquier otro oscilador.
La característica principal del Índice Compuesto es representar el momentum con señales operativas claras. Así, cuando el RSI entra en una zona de sobrecompra o sobreventa, el cruce del Índice Compuesto con sus medias móviles en la dirección opuesta representa una buena señal de trading, luego, enmarcando esta simbiosis del momentum del oscilador con la acción del precio en soportes y resistencias, obtienes una lógica de trading muy interesante y ganadora, que también es muy adecuada para operar con criptomonedas.
Cómo Usar
La Estrategia del Índice Compuesto es una estrategia de acción de precio basada en momentum que combina niveles de soporte y resistencia con los niveles de sobrecompra y sobreventa del Índice de Fuerza Relativa y el Índice Compuesto. El Índice Compuesto en esta estrategia de trading también es el momento final para la entrada.
Marco Temporal: H1+, Siempre úsalo con RSI.
Comprar
- El precio rebota en el soporte.
- Las medias móviles compuestas del RSI están por debajo del nivel 50 y la media móvil rápida (Roja) está por debajo de la media móvil lenta (amarilla).
- El RSI crea un mínimo y el valor está cerca o por debajo de 30 y también el Índice Compuesto tiene un mínimo.
- Entramos en largo en el momento en que el Índice Compuesto cruza hacia arriba las medias móviles.
Vender
- El precio rebota en la resistencia.
- Las medias móviles compuestas están por encima del nivel 50 y la media móvil rápida (Roja) está por encima de la media móvil lenta (amarilla)
- El RSI tiene un pico y el valor está cerca o por encima de 70 y también el Índice Compuesto tiene un pico.
- Entramos en corto cuando el Índice Compuesto cruza hacia abajo las medias móviles (este es el momento para la entrada en el mercado).
Resumen
Valoraciones de clientes
5 | 0 % | |
4 | 100 % | |
3 | 0 % | |
2 | 0 % | |
1 | 0 % |


