
La suite definitiva de velas japonesas está aquí para ayudarte a detectar la mayoría de los patrones de velas que existen hoy en día.
Los patrones de velas, que son herramientas técnicas de trading, se han utilizado durante siglos para predecir la dirección del precio. Hay varios patrones de velas utilizados para determinar la dirección y el impulso del precio, incluyendo three line strike, two red gapping, three red crows, evening star y abandoned baby.
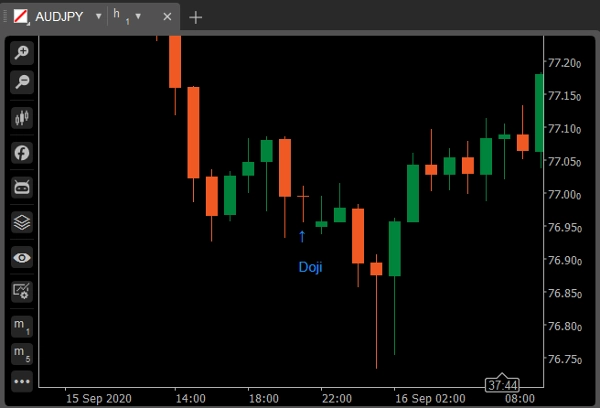
Doji
Una vela doji se forma cuando la apertura y el cierre de un valor son prácticamente iguales durante el período de tiempo dado y generalmente señala un patrón de reversión para los analistas técnicos. El umbral del cuerpo es como máximo el 5% de la longitud total.
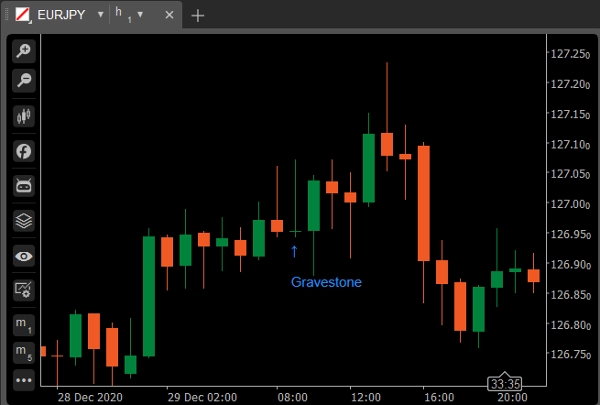
Variación: Gravestone Doji
Se forma cuando los precios máximo, apertura y cierre del activo son (casi) iguales. La larga sombra inferior sugiere que hubo una venta agresiva durante el período de la vela, pero dado que el precio cerró cerca de la apertura, muestra que los compradores pudieron absorber la venta y empujar el precio hacia arriba.
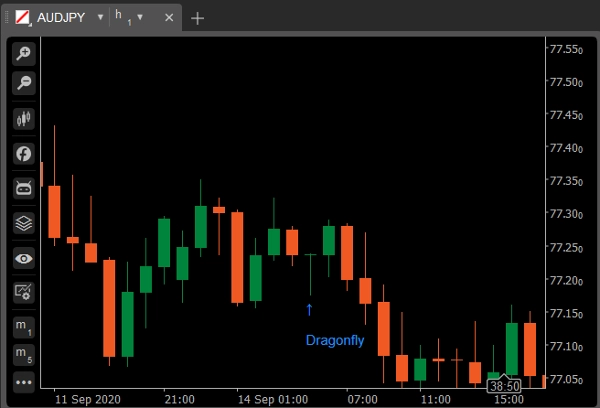
Variación: Dragonfly Doji
Un gravestone doji ocurre cuando los precios mínimo, apertura y cierre son (casi) iguales, y la vela tiene una larga sombra superior. El gravestone parece una "T" invertida. Las implicaciones para el gravestone son las mismas que para el dragonfly. Ambos indican posibles reversiones de tendencia pero deben ser confirmados por la vela que sigue.
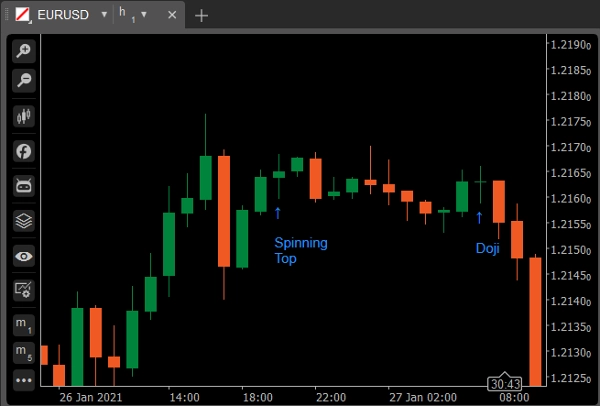
Spinning Top
Un spinning top es un patrón de vela con un cuerpo real corto que está centrado verticalmente entre largas sombras superior e inferior. El patrón de vela representa indecisión sobre la dirección futura del activo. Ni los compradores ni los vendedores pudieron tomar la ventaja. El umbral del cuerpo es como máximo el 20% de la longitud total.
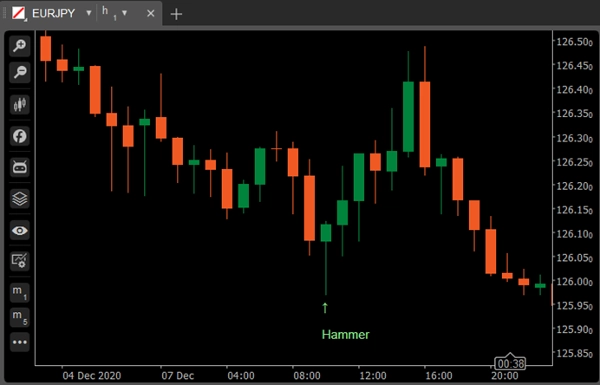
Hammer
Hammer Una vela verde o roja que consiste en un cuerpo pequeño cerca del máximo con poca o ninguna sombra superior y una larga cola inferior. Se considera un patrón alcista durante una tendencia bajista.
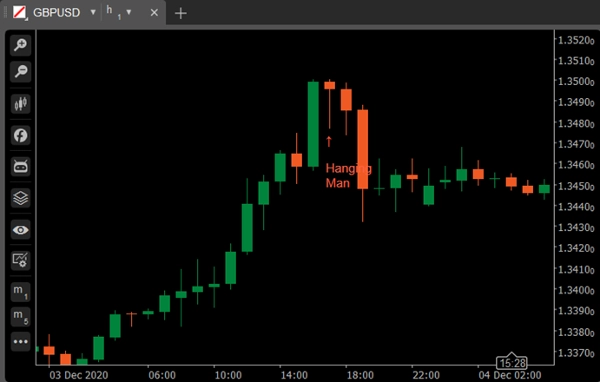
Variación: Hanging Man
Una vela verde o roja que consiste en un cuerpo pequeño cerca del máximo con poca o ninguna sombra superior y una larga cola inferior. Se considera un patrón bajista durante una tendencia alcista.
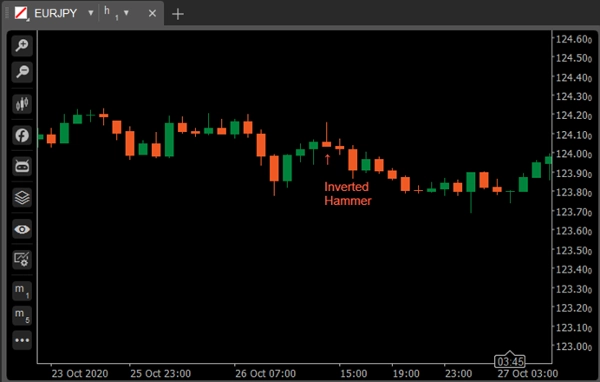
Inverted Hammer
El inverted hammer es un tipo de patrón de vela que se encuentra después de una tendencia bajista y generalmente se interpreta como una señal de reversión de tendencia.
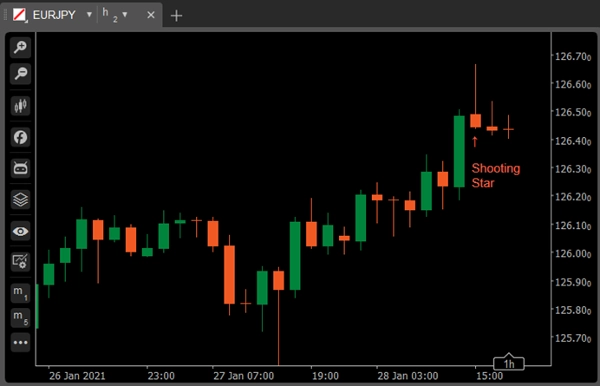
Variación: Shooting Star
El Shooting Star se ve exactamente igual que el Inverted hammer, pero en lugar de encontrarse en una tendencia bajista, se encuentra en una tendencia alcista y por lo tanto tiene implicaciones diferentes.
Marubozu
Una vela larga o normal (roja o verde) sin sombra ni cola. El máximo y el mínimo representan los precios de apertura y cierre. Se considera un patrón de continuación.
Variación: Marubozu Open
En cuanto al Marubozu open, el precio de apertura debe ser plano: es decir, la acción del precio debe moverse solo en una dirección, pero a diferencia de la vela Marubozu completa, el precio de cierre en el otro lado puede diferir ligeramente del máximo/mínimo. En otras palabras, la apertura debe ser plana, mientras que hay espacio para una mecha corta en el otro lado.
Variación: Marubozu Close
La vela Marubozu close es opuesta a la Marubozu open: el cierre debe ser plano mientras que la acción del precio puede moverse ligeramente en la otra dirección antes de comenzar a negociar agresivamente en una dirección.
Bullish Engulfing
Consiste en un cuerpo rojo más pequeño que está contenido dentro de la siguiente gran vela verde. Cuando aparece en el fondo se interpreta como una señal importante de reversión.
Bearish Engulfing
Consiste en un cuerpo verde más pequeño que está contenido dentro de la siguiente gran vela roja. Cuando aparece en la cima se considera una señal importante de reversión.
Piercing Line
Piercing Line Consiste en una vela roja seguida de una vela verde que abre por debajo del mínimo de la anterior pero cierra más de la mitad dentro del cuerpo de la vela roja. Se considera una señal de reversión cuando aparece en el fondo.
Dark Shadow Cover
Consiste en una larga vela verde seguida de una vela roja que abre por encima del máximo de la vela verde y cierra bien dentro del cuerpo de la vela verde. Se considera una señal de reversión bajista durante una tendencia alcista.
Bullish Harami
Consiste en un cuerpo rojo inusualmente grande seguido de un cuerpo verde pequeño (contenido dentro del cuerpo rojo grande). Se considera un patrón alcista cuando es precedido por una tendencia bajista.
Variación: Bullish Harami Cross
Un cuerpo rojo grande seguido de un Doji. Se considera una señal de reversión cuando aparece en el fondo.
Bearish Harami
Bearish Harami Consiste en un cuerpo verde inusualmente grande seguido de un cuerpo rojo pequeño (contenido dentro de un cuerpo verde grande). Se considera un patrón bajista cuando es precedido por una tendencia alcista.
Variación: Bearish Harami Cross
Un cuerpo verde grande seguido de un Doji. Se considera una señal de reversión cuando aparece en la cima.
Bullish/Bearish Kicker
La señal Bullish Kicker suele ocurrir después de una gran sorpresa en las noticias que se anuncia antes o después del horario del mercado. Algo drástico ha sucedido, causando un gran cambio en el sentimiento de los inversores, y una reversión inevitablemente seguirá. Cuanto mayor sea la brecha entre las dos velas, más significativa será la señal.
Morning/Evening Star
Consiste en una vela de cuerpo verde grande seguida de una vela de cuerpo pequeño (rojo o verde) que hace un gap por encima de la anterior. La tercera es una vela de cuerpo rojo que cierra bien dentro del gran cuerpo verde. Se considera una señal de reversión cuando aparece en el nivel superior.
Variación: Abandoned Baby
Three Green Soldiers/Three Red Crows
Consiste en tres largas velas verdes con cierres consecutivamente más altos. Los precios de cierre están cerca o en sus máximos. Cuando aparece en el fondo se interpreta como una señal de reversión de fondo.
Consiste en tres largas velas rojas con cierres consecutivamente más bajos. Los precios de cierre están cerca o en sus mínimos. Cuando aparece en la cima se considera una señal de reversión de techo.
Three Line Strike
Un three line strike es un grupo de velas de continuación que tiene tres en la dirección de una tendencia seguidas por una vela final que retrocede hasta el punto de inicio. Los traders usan el three line strike como una oportunidad para comprar en un mínimo reciente de la tendencia o vender en un máximo reciente.
Two Red Gapping
El patrón de continuación bajista two red gapping aparece después de un máximo notable en una tendencia alcista, con un gap a la baja que produce dos barras rojas con mínimos más bajos. Este patrón predice que la caída continuará hasta mínimos aún más bajos.
5 | 100 % | |
4 | 0 % | |
3 | 0 % | |
2 | 0 % | |
1 | 0 % |


