
Mô tả
Mục đích của thuật toán cTrader này của chỉ báo Boxify là cố gắng đưa hành động giá vào các vùng, hoặc tốt hơn, là các hộp. Bằng cách này, nhà giao dịch có thể có lợi thế trong các vị thế giao dịch của mình. Đây không phải là một chỉ báo có thể đứng độc lập, mà là một công cụ hữu ích có thể bổ sung cho bất kỳ chiến lược hoặc thiết lập giao dịch nào.
Phát hiện chuyển động ngang có thể giúp nhà giao dịch bảo vệ lợi nhuận, cắt lỗ hoặc đặt các lệnh giới hạn có lợi cho mình. Đây là một vài cách mà chúng ta có thể sử dụng một hộp:
Phát hiện các vùng tích lũy
Đối với các hộp trong quá khứ chứa nhiều thanh bên trong, chúng ta có thể chắc chắn rằng đây là các vùng tích lũy và chúng ta có chuyển động ngang. Những vùng này có thể đóng vai trò là các mức hỗ trợ hoặc kháng cự trong phân tích hành động giá của bạn.
Đặt giao dịch tốt hơn
Trong trường hợp bạn có một thiết lập để giao dịch và bạn thấy giá đang nằm trong hộp, bạn luôn có thể sử dụng hộp như một hướng dẫn cho hành động giá, để có vị thế có lợi hơn cho giao dịch của bạn. Hộp đang hình thành hiện tại có thể được sử dụng để bảo vệ một phần lợi nhuận trong vị thế thắng, tái nhập thị trường xu hướng hoặc đặt lệnh dừng lỗ.
Đặt lệnh giới hạn
Chuyển động ngang kéo dài cuối cùng sẽ dẫn đến các đột phá. Boxify có thể giúp bạn đặt các lệnh giới hạn, phía trên hoặc phía dưới, để tận dụng tối đa sự khởi đầu của một đột phá.
Tùy chọn chỉ báo
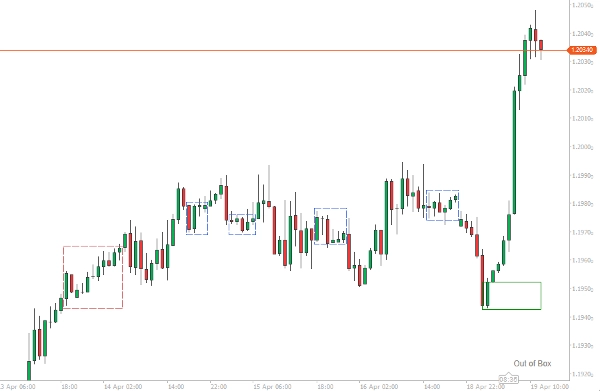
Chỉ báo sẽ cố gắng tạo hộp giá từ ít nhất 2 thanh trở lên. Các thông báo từ chỉ báo sẽ xuất hiện ở góc dưới bên phải của khu vực biểu đồ.
- Nếu giá đang trong xu hướng, thông báo “Out of Box” sẽ xuất hiện.
- Nếu giá đang nằm trong hộp, thông báo “Boxing” sẽ xuất hiện.
- Nếu giá đang nằm trong hộp và giá phá vỡ giới hạn trên, “Breaking High” sẽ xuất hiện.
- Nếu giá đang nằm trong hộp và giá phá vỡ giới hạn dưới, “Breaking Low” sẽ xuất hiện.
Các hộp được coi là hoàn thành khi một thanh mới mở cửa, vì giá luôn có thể quay lại trong hộp.
Số thanh tối thiểu cho hộp
Con số này đại diện cho số thanh tối thiểu mà một hộp phải có để được coi là hoàn thành. Sử dụng số thấp hơn cho điểm vào, và số cao hơn cho các vùng tích lũy.
Bộ lọc ATR
Boxify có tích hợp chỉ báo ATR bên trong, bạn có thể sử dụng như một tùy chọn lọc, trong trường hợp bạn muốn dừng việc hình thành hộp trên bất kỳ thanh nào mà độ dài của nó (Cao-Thấp) vượt quá giá trị ATR. Sử dụng tùy chọn này nếu bạn muốn vào lệnh giao dịch.
Gộp các vùng chồng lấn
Bắt đầu của một hộp có thể bắt đầu trước khi hộp trước đó kết thúc (đặc biệt nếu chúng ta chọn số rất thấp cho độ dài hộp). Chúng ta có thể gộp các hộp này với tùy chọn này, để thấy một hộp lớn hơn đang hình thành – Những hộp này sẽ có viền màu xanh dương.
Độ dung sai
Một con số phản ánh độ dung sai mà giới hạn trên/dưới của các hộp có thể có. Nên sử dụng số nhỏ khi muốn vào lệnh giao dịch, số lớn hơn khi muốn tìm các vùng tích lũy.
Tóm tắt
Đánh giá của khách hàng
5 | 33 % | |
4 | 67 % | |
3 | 0 % | |
2 | 0 % | |
1 | 0 % |


