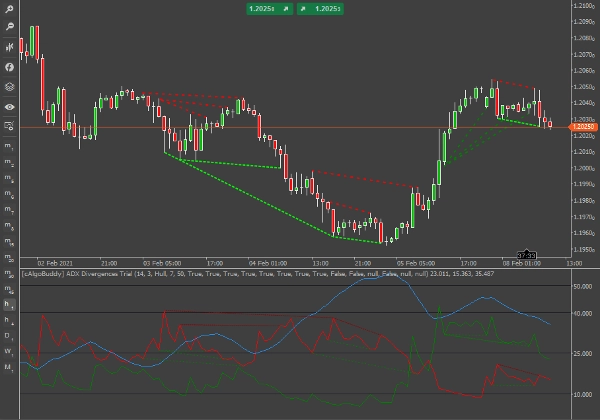
Descrizione
Introduzione ad ADX
ADX (linea blu) è tracciato come una singola linea con valori che vanno da un minimo di zero a un massimo di 100. ADX è non direzionale; registra la forza del trend sia che il prezzo stia salendo o scendendo. L'indicatore è solitamente tracciato nella stessa finestra delle due linee dell'indicatore di movimento direzionale (Di+ e Di-), da cui ADX è derivato.
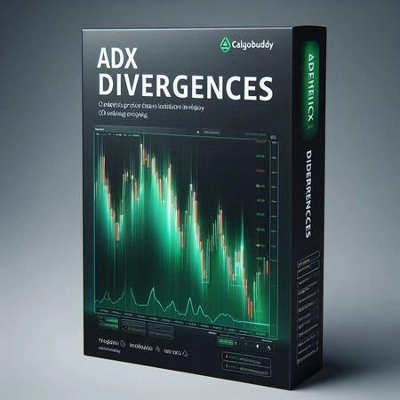
Questo indicatore individua divergenze sulle linee Di+ e Di-. A differenza di altri indicatori che individuano divergenze, con questo possiamo estrarre informazioni più preziose dagli altri 2 corrispondenti di un segnale di divergenza. Per esempio, se si verifica una divergenza su Di+, possiamo valutare il segnale tenendo conto dei livelli di Di- e ADX.
Le linee Di+ e Di- sono parzialmente smussate con una media mobile Hull su 3 periodi. Per una frenesia di divergenza al 100%, puoi impostare il periodo della MA a 1 e il tipo di media mobile su Semplice. Tuttavia, poiché tracciamo divergenze su 2 linee nella stessa finestra dell'indicatore, a volte potresti sentirti sopraffatto dai segnali. D'altra parte, puoi selezionare dalle impostazioni dell'indicatore esattamente quali tipi di divergenze vuoi vedere e per quale linea (Di+ o Di-).
Un segnale di divergenza è considerato confermato all'apertura della barra successiva a una divergenza. Tuttavia, a causa della natura “inflessibile” delle linee di trend ADX (in confronto, per esempio, all'RSI) ogni volta che appare una linea di divergenza, probabilmente rimarrà lì fino alla barra di conferma, a meno che non si verifichi una volatilità estrema.
Prima di operare su qualsiasi segnale di divergenza, identifica quanto segue:
- Direzione e livello di ADX
- Distanza tra Di+ e Di-
- Direzione e livello di Di+
- Direzione e livello di Di-
Inoltre, tieni presente
- Evita di prendere qualsiasi operazione di divergenza quando l'ADX è basso (inferiore a 15 e in trend discendente), poiché i segnali dovrebbero essere presi basandosi su trend già sviluppati o in via di sviluppo.
- Ricorda anche che l'incrocio di Di+ e Di- è considerato un segnale rialzista/ribassista di per sé, quindi modifica le tue posizioni di conseguenza.
- Nel caso in cui sia Di+ che Di- divergano sulla stessa candela, scegli la linea corrispondente migliore a seconda del trend (trend rialzista/segnale rialzista Di+, trend ribassista/segnale ribassista Di-).
- Non è necessario operare su ogni segnale.
Divergenze su DiPlus
DiPlus (Verde) è la linea che traccia la forza del trend rialzista. Possiamo individuare divergenze tra la forza del trend rialzista in modo simile alla maggior parte degli oscillatori.
Divergenza Rialzista Regolare
Definizione: Il prezzo ha fatto un minimo più basso ma l'indicatore ha fatto un minimo più alto. Il risultato ideale è: dopo un piccolo rialzo, dovremmo vedere svilupparsi un trend ribassista. Tracciato con una linea verde chiaro tratteggiata nelle finestre del prezzo e dell'indicatore.
Un trend ribassista dominante che sta iniziando a svilupparsi o è già sviluppato. Andiamo short dopo che la piccola correzione è avvenuta. In alcuni casi, la divergenza su Di+ può verificarsi su una candela ribassista, una buona conferma del trend ribassista dominante.
Occasionalmente, il rialzo porterà allo sviluppo di un trend rialzista. Questo può accadere quando c'è poco o nessun trend (Di+ e Di- sono vicini tra loro, ADX< 20) o dopo l'esaurimento del trend ribassista su livelli di resistenza.
Divergenza Rialzista Nascosta
Definizione: Il prezzo ha fatto un minimo più alto e l'indicatore ha fatto un minimo più basso. Dovremmo aspettarci uno sviluppo o una continuazione del trend rialzista. Tracciato con una linea verde scuro parzialmente tratteggiata nelle finestre del prezzo e dell'indicatore.
Un trend rialzista dominante che sta iniziando a svilupparsi o è già sviluppato. Andiamo long dopo che la piccola correzione è avvenuta. Lo stop-loss dovrebbe essere posizionato intorno al minimo della candela di divergenza.
Uno dei segnali migliori di questo indicatore, principalmente perché ci aspettiamo una continuazione immediata del trend e possiamo mantenere gli stop loss al minimo.
Divergenza Ribassista Regolare
Definizione: Il prezzo ha fatto un massimo più alto ma l'indicatore ha fatto un massimo più basso. Dopo una piccola discesa ribassista, dovremmo vedere svilupparsi un trend rialzista. Tracciato con una linea rossa scura tratteggiata nelle finestre del prezzo e dell'indicatore.
Un trend rialzista dominante è ancora in crescita (ADX ancora in aumento al momento della divergenza).
Le circostanze per cui questo scenario si verifica sono molto rare poiché Di+ rappresenta la forza rialzista. Di solito, queste circostanze si verificano dopo che il trend rialzista si è esaurito, il che significa che è il “picco” finale prima che inizi a svilupparsi il trend ribassista. Quindi, la maggior parte delle volte si consiglia di andare short su questo segnale.
Divergenza Ribassista Nascosta
Definizione: Il prezzo ha fatto un massimo più basso e l'indicatore ha fatto un massimo più alto. Dovremmo aspettarci una continuazione del trend ribassista. Tracciato con una linea rossa parzialmente tratteggiata nelle finestre del prezzo e dell'indicatore.
Un trend ribassista dominante con picchi rialzisti (ADX ancora in aumento al momento della divergenza).
Chiedere una continuazione del trend ribassista dalla linea del trend rialzista è controintuitivo, per questo motivo questo segnale dovrebbe essere preso con molta cautela. Spesso, il mercato entrerà in una fase di consolidamento dopo questa divergenza.
In un mercato senza trend, evita di prendere operazioni. In un trend ribassista esaurito, se scegli di andare short, fai scalp.
Divergenze su DiMinus
DiMinus (Rosso) è la linea che traccia la forza del trend ribassista. Il modo in cui individuiamo le divergenze tra prezzo e DiMinus è in qualche modo l'inverso del modo in cui individuiamo le divergenze su DiPlus.
Divergenza Rialzista Regolare
Definizione: Il prezzo ha fatto un minimo più basso ma l'indicatore ha fatto un massimo più basso (invece di un minimo più alto). Dopo un piccolo rialzo, dovremmo vedere svilupparsi un trend ribassista. Tracciato con una linea verde chiaro tratteggiata nella finestra del prezzo e una linea rossa scura tratteggiata nella finestra dell'indicatore.
Un trend ribassista dominante che sta iniziando a svilupparsi o è già sviluppato. Andiamo short dopo che la piccola correzione è avvenuta. In alcuni casi, la divergenza su Di- può verificarsi su una candela ribassista, una buona conferma del trend ribassista dominante.
Proprio come il segnale proveniente dal corrispondente Di+, a volte il rialzo ribassista svilupperà un trend ribassista. Questo può accadere quando c'è poco o nessun trend (Di+ e Di- sono vicini tra loro, ADX< 20) o dopo l'esaurimento del trend rialzista su livelli di resistenza.
Divergenza Rialzista Nascosta
Definizione: Il prezzo ha fatto un minimo più alto e l'indicatore ha fatto un massimo più alto (invece di un minimo più basso). Dovremmo aspettarci una continuazione del trend rialzista. Tracciato con una linea verde parzialmente tratteggiata nella finestra del prezzo e una linea rossa scura parzialmente tratteggiata nella finestra dell'indicatore.
È controintuitivo chiedere una continuazione del trend rialzista dalla linea del trend Di-. Abbiamo bisogno di picchi ribassisti in un trend rialzista.
Divergenza Ribassista Regolare
Definizione: Il prezzo ha fatto un massimo più alto ma l'indicatore ha fatto un minimo più alto (invece di un massimo più basso). Dopo una discesa ribassista nel prezzo, dovremmo vedere una continuità del trend rialzista. Tracciato con una linea rossa scura tratteggiata nella finestra del prezzo e una linea verde chiaro tratteggiata nella finestra dell'indicatore.
Si consiglia, in un trend rialzista forte e in sviluppo, di andare long. Ma, in un mercato rialzista esaurito e speso, andare short.
Divergenza Ribassista Nascosta
Il prezzo ha fatto un massimo più basso e l'indicatore ha fatto un minimo più basso (invece di un massimo più alto). Dovremmo aspettarci una continuazione del trend ribassista. Tracciato con una linea rossa parzialmente tratteggiata nella finestra del prezzo e una linea verde parzialmente tratteggiata nella finestra dell'indicatore.
Uno dei segnali migliori di questo indicatore, principalmente perché ci aspettiamo una continuazione immediata del trend ribassista e possiamo mantenere gli stop loss al minimo. Lo stop-loss dovrebbe essere posizionato al minimo della candela di divergenza.
Avvisi Istantanei di Messaggi Telegram
Dato che hai un bot e un canale configurati su Telegram, l'indicatore ADX Divergences ti invierà messaggi per segnali confermati sulla coppia di valute su cui lo esegui. Tieni presente che riceverai segnali solo per quelli per cui hai selezionato "Sì" per la visualizzazione. Puoi configurare questo robot di trading per inviare anche avvisi Telegram istantanei direttamente al tuo PC, tablet o telefono mobile.
IMPORTANTE: Assicurati che il tuo fuso orario sia correttamente impostato sull'ora locale (angolo in basso a destra dell'applicazione).
Avvisi Desktop
Se selezioni Sì, l'indicatore ADX Divergences invierà una notifica a comparsa sul desktop personale per segnali confermati.
Avvisi Email
Perché questa funzionalità funzioni, devi prima configurare il tuo cTrader per poter inviare email (Impostazioni-> Email). Se selezioni Sì, l'indicatore ADX Divergences invierà un'email sui segnali confermati all'indirizzo che hai inserito.
Riepilogo
This indicator detects divergences on both Di+ and Di- lines, allowing traders to analyze signals with additional context from the other directional lines and ADX levels. The Di+ and Di- lines are smoothed using a Hull moving average, adjustable via settings to control signal sensitivity and display preferences.
Divergence signals are confirmed at the opening of the bar following the divergence, with guidance provided on interpreting various divergence types—regular and hidden bullish and bearish divergences—on both Di+ and Di- lines. Users are advised to consider ADX levels, the distance between Di+ and Di-, and the direction and level of each line before trading signals.
The indicator supports instant alerts via Telegram messages, desktop notifications, and email, configurable within the platform. Proper time zone settings are required for accurate alert timing. This tool is applicable across multiple markets including Forex, commodities, indices, stocks, and cryptocurrencies such as BTCUSD and XAUUSD.
Recensioni dei clienti
5 | 80 % | |
4 | 20 % | |
3 | 0 % | |
2 | 0 % | |
1 | 0 % |