
Half Trend BT
Indicator
38 purchases
Version 1.0, Mar 2025
Windows, Mac
4.3
Reviews: 3
Description
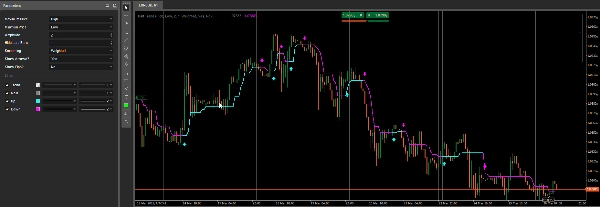
The Half Trend indicator is designed to detect and highlight potential trend reversals by comparing recent highs and lows over a specified period, then plotting an “Up” or “Down” line accordingly. It optionally draws arrows at each trend change and can display pip differences between signals.
- High/Low Series Selection
- The indicator uses two price series (High and Low by default) to track local maxima and minima.
- You can select different price types (e.g.,
Open,Close,Median, etc.) for each series via Maximum Price and Minimum Price.
- Moving Averages & Period Calculation
- A moving average (based on the chosen Smoothing type and Amplitude period) is applied to both the selected “high” and “low” price series.
- The indicator compares current bar prices against these smoothed high/low levels to decide whether to switch from an uptrend to a downtrend (or vice versa).
- Trend Detection & Plotting
- If the indicator identifies an uptrend, it plots the Up line (cyan) and sets
Trendto+1. - If it detects a downtrend, it plots the Down line (magenta) and sets
Trendto-1. - The Main output (gray) updates internally to reflect the current support/resistance levels.
Trendis an invisible output series storing the trend direction numerically (+1or-1).
- If the indicator identifies an uptrend, it plots the Up line (cyan) and sets
- Arrows & Pip Calculation
- Show Arrows? – If enabled, the indicator draws an arrow on each new bar where a trend reversal is detected.
- Show Pips? – If enabled, it calculates and displays the pip difference between the last signal and the new signal, drawing a small label and a trendline on the chart.
Summary
AI summary
The Half Trend BT indicator detects potential trend reversals by analyzing recent highs and lows over a specified period. It compares two selected price series—typically High and Low, but configurable to other price types such as Open, Close, or Median—using moving averages based on chosen smoothing methods and amplitude periods. The indicator plots an "Up" line (cyan) when an uptrend is detected and a "Down" line (magenta) for a downtrend, while internally storing trend direction numerically (+1 or -1). A main output line (gray) reflects current support and resistance levels. Optional features include drawing arrows on bars where trend reversals occur and calculating pip differences between signals, which are displayed as labels and trendlines on the chart. This indicator supports multiple markets including Forex, indices, commodities, cryptocurrencies, and stocks.
Indicator profile
Customer reviews
4.3
Reviews: 3
5 | 33 % | |
4 | 67 % | |
3 | 0 % | |
2 | 0 % | |
1 | 0 % |
Customer reviews
March 29, 2025
Clean idea for traders around chart reading. The useful part is adding confirmation before a trade, with the numbers checked before scaling. The cleaner reads should hold across 3 sessions, not just 1 good chart. It is stronger when a 1.5R target is realistic before the entry.
March 28, 2025
March 28, 2025
Decent tool for testing if the trader wants it makes market context easier to scan. It works best as support, not a final decision maker. I would test it on 2 timeframes, 20 signals and a 1R stop plan. it should not be used as a blind entry trigger.
Discussion
FAQ
Prop
Forex
Signal
Indices
Commodities
Crypto
Stocks
Products available through cTrader Store, including trading bots, indicators and plugins, are provided by third-party developers and made available for informational and technical access purposes only. cTrader Store is not a broker and does not provide investment advice, personal recommendations or any guarantee of future performance.


Price
48
Sales
1.07K
Free installs