
Price Level DWM BT
Indicator
Version 1.0, Dec 2025
Windows, Mac
4.7
Reviews: 4
Description
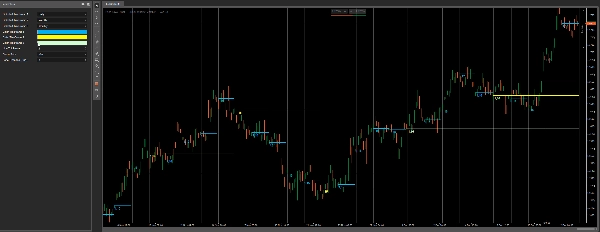
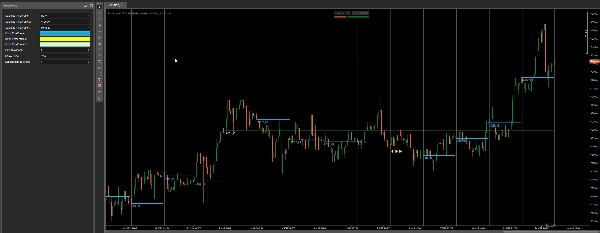
Price Level DWM by Bullitt Traders
Price Level DWM Daily Weekly Monthly Price Change Levels plots clean, higher-timeframe reference levels directly onto your chart — so you always know where price stands relative to key Daily, Weekly and Monthly benchmarks.
These levels are widely used for:
- bias & direction context
- intraday support/resistance reactions
- mean-reversion vs. continuation decisions
- “location trading” (where price is trading vs. the higher timeframe)
Keep your chart minimal, fast and readable while still having the HTF context in view.
What you get
- Up to 3 higher-timeframe reference levels at the same time
- Daily / Weekly / Monthly selectable via dropdown
- Separate colors per timeframe
- Adjustable thickness
- Optional price label (clean and unobtrusive)
Key Features
- Minimalist HTF level plotting (designed for clean charts)
- Non-repainting reference levels (based on completed HTF data)
- Works great with sessions, S&D zones, market structure, ICT tools and more
- Suitable for FX, indices, gold — any market
Settings
- Select TimeFrame 1 / 2 / 3
- Color per timeframe
- Line thickness
- Show price label (on/off)
- Label distance (visual offset)
Notes
- Uses completed higher-timeframe data to keep levels stable and consistent.
Summary
Indicator profile
Indicator category
Volatility
Output type
Signals
Data requirements
External data
Supported signals
Level break
Customer reviews
4.7
Reviews: 4
5 | 75 % | |
4 | 25 % | |
3 | 0 % | |
2 | 0 % | |
1 | 0 % |
Customer reviews
February 9, 2026
Price Level DWM BT provides clean and accurate daily, weekly and monthly levels. Best used from M5 and higher timeframes, where levels stay readable and meaningful. A great context tool for intraday and swing traders who rely on higher-TF structure, reactions and trade planning.
December 18, 2025
The setup needs less second guessing, but overconfidence is the real danger.
December 15, 2025
pretty fine as one more layer, especially in mixed charts. A few signals across sessions tell more.
Discussion
FAQ
Prop
Forex
Signal
Breakout
Scalping
Commodities
Crypto
Products available through cTrader Store, including trading bots, indicators and plugins, are provided by third-party developers and made available for informational and technical access purposes only. cTrader Store is not a broker and does not provide investment advice, personal recommendations or any guarantee of future performance.


Price
48
Sales
1.05K
Free installs