Brokers & props
For business
00
Days
:
00
Hours
:
00
Minutes
:
00
Seconds
DXY Valuation Zones 1.0 BT
Indicator
Version 1.0, Feb 2026
Windows, Mac
Since 23/02/2025
Sales
18
Free installs
403
"DXY Valuation Zones 1.0 BT" uploaded image"DXY Valuation Zones 1.0 BT" uploaded image
About trial version
14 Days Trial

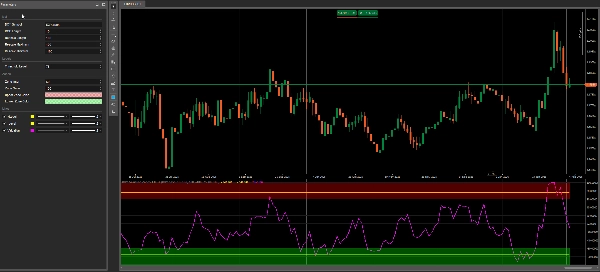
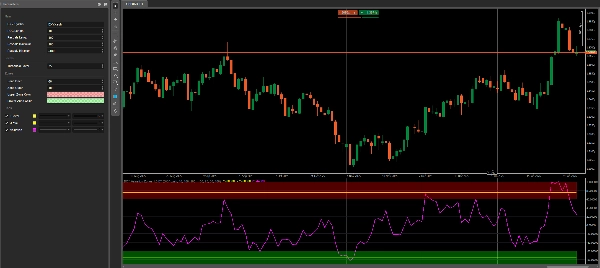
DXY Valuation Zones 1.0 BT shows a clean DXY-relative valuation line for your chart symbol and highlights two simple context areas: an Over Zone and an Under Zone.
It’s built as a Daily (D1) context filter — no clutter, just clear zones + a configurable ±Threshold level.

All zone colors use the native cTrader color picker, so you can control transparency directly via the opacity slider inside the palette.

Recommended Use (Best on Daily)

This indicator works best on USD-related pairs, because DXY represents broad USD strength.

Examples:

  • XXXUSD: EURUSD, GBPUSD, AUDUSD, NZDUSD
  • USDXXX: USDJPY, USDCAD, USDCHF

Quick Start (recommended defaults)

  • Timeframe: Daily (D1)
  • Over Zone: +70 … +100
  • Under Zone: -70 … -100
  • Threshold: ±75 (adjustable)
  • DXY Symbol: DXY.cash (or your broker’s DXY name)


How it works (simple)

  1. Calculates ROC (percent change) for your chart symbol
  2. Calculates the same ROC for DXY
  3. Uses the difference (Symbol ROC – DXY ROC)
  4. Rescales the result into a stable -100 … +100 range


How to read it

  • Valuation > +Threshold → stretched / “Over” context
  • Valuation < -Threshold → stretched / “Under” context
  • In-between → neutral context

Use it as a bias & location filter, not as a standalone entry signal.


Important (Broker requirement)

This indicator requires a broker-provided DXY symbol (example: DXY.cash).
Tested on FTMO (availability and naming may vary by broker feed).
If your broker uses a different name, just change the DXY Symbol pa

0.0
Reviews: 0
Customer reviews
No reviews for this product yet. Already tried it? Be the first to tell others!
Prop
Forex
Signal

More from this author

Indicator
Forex
Signal
Market Session BT
Market Session BT
Indicator
Indices
Prop
Commodities
+4
Half Trend BT
Half Trend BT by BullittTraders
Indicator
Indices
Prop
Commodities
+3
Camarilla 1.5 BT
Camarilla by Bullitt Traders — a precise, non-repainting pivot indicator for cTrader.
Indicator
Indices
Prop
Commodities
+3
HMA MTF 2.0
HMA MTF 2.0 (Multi-Timeframe )
Indicator
NAS100
NZDUSD
Indices
+9
Belkhayate PRC BT
Belkhayate PRC (Polynomial Regression Channel)
Indicator
Indices
Breakout
Prop
+2
Price Change Bundle 1.0 BT
Price Change Bundle 3-in-1 Levels • Bars • Histogram. Secret of Price Change
Indicator
Indices
Prop
Stocks
+3
Bar Time
Bar Time Timeframe / Renko
Indicator
Indices
Breakout
Prop
+6
Price Level DWM BT
Price Level DWM BT
Indicator
NAS100
NZDUSD
XAUUSD
+11
Half Trend Cloud BT
Half Trend Cloud

You may also like

Indicator
NAS100
NZDUSD
Martingale
+26
Smart Money Gaps
Smart Money Gaps: MTF FVG auto-detection, extension, and mitigation marker. Trade institutional imbalances.
Indicator
NAS100
XAUUSD
Commodities
+10
MARKET_STRUCTURE BOS_CHoCH
MarketStructurePro – Smart BOS/CHoCH
IR Candle Open
IR Candle Open plots customizable opening price lines for daily, weekly, and monthly candles
Indicator
NAS100
Indices
XAUUSD
+6
SessionGuard - Session High-Low Box
Visual session structure showing Asia, London and New York high/low ranges directly on the chart.
Indicator
Commodities
Forex
Crypto
+1
timer
This is a simple indicator to show the remaining time of a candle
Indicator
XAUUSD
Commodities
Forex
+4
GoldLine_V1.2
Advanced price levels! Rounded prices with full style settings. Suitable for all currency pairs and timeframes.
Indicator
RSI
Signal
MA-RSI HTF Confirmation
MA-RSI HTF Confirmation: Eliminate false signals and trade with confidence!
Weekly Daily Levels
The Weekly Daily Levels indicator shows the OHLC, and mid-point prices for the previous day and week.
ZigZag Price Liquidity Projection
📊 ZigZag Liquidity Projection: Predict bounces/breaks using pivots, ATR & volume.
Indicator
RSI
Forex
Signal
+2
Rsi_custom
🔹 Advanced RSI with smart alerts and visual signals for faster trend reversal detection.
Indicator
Grid
XAUUSD
Breakout
+12
heatmap kopie
Dynamic Liquidity Depth exposes hidden volume
[Stellar Strategies] Inside Bar with Signals
Visually master the Inside Bar strategy with clear breakout signals and professional chart highlighting 📈🔔📉