
Descrizione
Uno degli errori più grandi che i nuovi trader commettono è cercare di creare quante più informazioni possibili su un grafico aggiungendo troppi indicatori e il risultato è un grafico pieno di rumore con linee e dati che forniscono ogni sorta di sciocchezze che danno al trader una storia contraddittoria.
Vantaggi:
- Precisione sorprendente nel rilevare inversioni.
- Condizioni di mercato visivamente piacevoli e facili da vedere.
- Può essere usato come indicatore di trading di tendenza o di trading contro-tendenza.
- Risultati forti nei back-test (~95% di precisione sui segnali Extreme).
Svantaggi:
- Anche con condizioni di "Extreme" ipercomprato e "Extreme" ipervenduto, l'indicatore a volte può farti operare nella direzione opposta di una tendenza molto forte causando grandi drawdown prima che il prezzo si inverta eventualmente.
- I segnali di "Extreme" ipercomprato e "Extreme" ipervenduto possono essere pochi e distanti tra loro quando si opera sul timeframe a 15 minuti e superiori. Per contrastare questo, si consiglia di operare almeno su 8 coppie Major per ricevere spesso segnali Extreme.
Come usare Chaos Reversals
Un sistema semplice e vincente usando Chaos può essere creato segnando le linee di Supporto e Resistenza Settimanali e Giornalieri e operando contro-tendenza sui rimbalzi in avvicinamento da quelle linee di supporto e resistenza usando i segnali di Overbought Extreme e Oversold Extreme del Chaos a 15 minuti.
I segnali vengono generati come segue:
- Il W%R veloce si muove per primo, seguito dal W%R lento.
- Quando il singolo W%R veloce è ipervenduto o ipercomprato, puoi fare scalp su queste inversioni.
- Quando sia il W%R veloce che quello lento sono ipervenduti o ipercomprati, questi mostrano che il mercato sta per invertire in modo significativo.
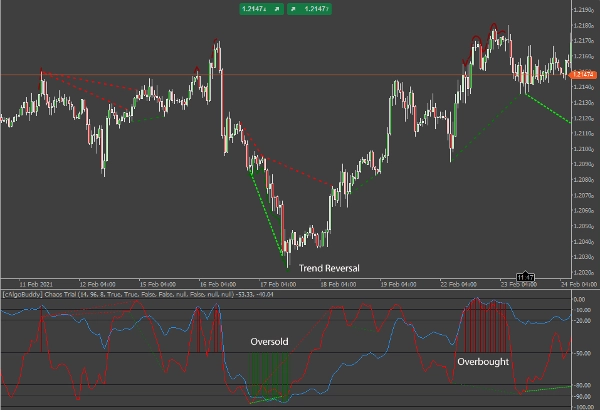
L'indicatore disegnerà una linea rossa o verde sopra i minimi o massimi sul grafico dei prezzi, così come disegnerà linee rosse o verdi nell'area dell'indicatore per segnare le condizioni estreme di ipervenduto o ipercomprato. Puoi disabilitare questo nelle opzioni dell'indicatore.
Individuazione delle Divergenze
Poiché W%R è un oscillatore, ci dà l'opportunità di individuare e operare sulle divergenze. Ci sono due tipi principali di Divergenza: Regolare e Nascosta.
- La divergenza regolare è un'indicazione di un'inversione nella direzione del prezzo.
- La divergenza nascosta è un'indicazione di una continuazione nella direzione del prezzo.
All'interno di ogni tipo principale, c'è una classificazione secondaria: Ribassista (Negativa) e Rialzista (Positiva).
- Una divergenza ribassista si verifica quando l'indicatore scende mentre il prezzo sale o si stabilizza.
- Una divergenza rialzista si verifica quando l'indicatore sale mentre il prezzo scende o si stabilizza.
Divergenza Regolare
La Divergenza Regolare in termini semplici è quando:
- Il prezzo fa massimi più alti mentre la linea veloce del W%R fa massimi più bassi: potenziale Short.
- Il prezzo fa minimi più bassi mentre la linea veloce del W%R fa minimi più alti: potenziale Long.
In entrambi i casi, un trader cerca una potenziale inversione nell'azione del prezzo.
La divergenza regolare è meglio utilizzata come confronto tra l'attuale Swing High o Swing Low e il precedente Swing High o Swing Low. Con la divergenza regolare, la tendenza si sta indebolendo e il sentimento di mercato si è spostato nella direzione opposta. I trader possono prepararsi a operare una inversione o un ritracciamento favorevole.
Nel Chaos Reversals, la divergenza regolare è mostrata come segue:
- Divergenza Regolare Rialzista – Linea verde brillante tratteggiata stretta.
- Divergenza Regolare Ribassista – Linea rossa tratteggiata stretta
NOTA: Le linee di divergenza appaiono all'apertura della barra successiva a una divergenza confermata.
Divergenza Nascosta
La Divergenza Nascosta in termini semplici è quando:
- La linea veloce del W%R fa minimi più bassi mentre il prezzo fa minimi più alti: un potenziale Long.
- La linea veloce del W%R fa massimi più alti mentre il prezzo fa massimi più bassi: un potenziale Short.
In entrambi i casi, un trader cerca una potenziale continuazione nell'azione del prezzo.
La divergenza nascosta è meglio utilizzata per valutare i prezzi relativi alla tendenza prevalente. Dopo un ritracciamento, il prezzo spesso continua nella direzione della tendenza verso il livello dell'ultimo Swing High o Swing Low. Con la divergenza nascosta, la tendenza può essere in indebolimento ma non è ancora completata. Come mostrato sotto, il mercato ha fatto un ritracciamento probabilmente dovuto a prese di profitto e sembra riprendere il trend ribassista.
Nel Chaos Reversals, la divergenza nascosta è mostrata come segue:
- Divergenza Nascosta Ribassista – Linea verde tratteggiata larga
- Divergenza Nascosta Rialzista – Linea rossa scura tratteggiata larga
Trading con la Divergenza
Questa è una breve nota di cautela quando si opera con la Divergenza. Sii consapevole che il mercato potrebbe non muoversi nella direzione di un segnale di Divergenza. È importante capire che la Divergenza è un'indicazione di un potenziale cambiamento o continuazione nella direzione del mercato. È importante monitorare il movimento del prezzo per confermare la direzione del mercato. Inoltre, prendi nota della direzione complessiva dell'Indicatore Chaos, confrontando le linee dell'indicatore con i livelli (0 per ipercomprato estremo, -100 per ipervenduto estremo)
Avvisi e Notifiche
I segnali che verranno inviati sono l'inizio e la fine di condizioni Extreme Overbought/Oversold, il picco del W%R lento in posizioni estreme così come tutte le divergenze.
Avvisi Telegram
Dato che hai un bot e un canale configurati su Telegram, l'indicatore Chaos Reversals ti invierà messaggi per segnali confermati sulla coppia di valute.
IMPORTANTE:
Assicurati che il tuo fuso orario sia correttamente impostato sull'ora locale (angolo in basso a destra dell'applicazione).
Avvisi Desktop
Se selezioni Sì, l'indicatore Chaos Reversals invierà una notifica a comparsa sul desktop personale per segnali confermati.
Avvisi Email
Per far funzionare questa funzionalità, devi prima configurare il tuo cTrader per poter inviare email (Impostazioni-> Email).
Riepilogo
Recensioni dei clienti
5 | 100 % | |
4 | 0 % | |
3 | 0 % | |
2 | 0 % | |
1 | 0 % |


