
Descrizione
🧭 Cronometra i tuoi scambi: Atlas rivela quando i mercati tendono a muoversi per mese, giorno della settimana e ora. 🧭
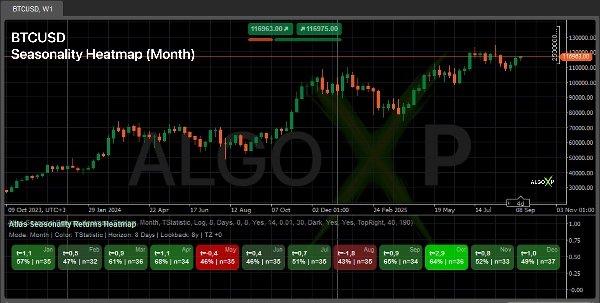
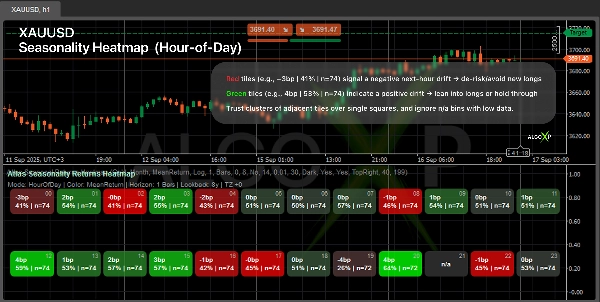
Vedi quando il tuo mercato tende a muoversi — per Mese, Giorno della Settimana o Ora del Giorno.
Atlas calcola rendimenti futuri su un orizzonte che scegli e disegna una mappa di calore simmetrica (Giù → Zero → Su). Ogni riquadro mostra una metrica (Media, T-stat, o Sharpe) più percentuale di successo | n. Usalo per cronometrare ingressi/uscite, pianificare sessioni e filtrare il rischio.
🎯 Perché i trader lo usano
- Individua finestre verdi per entrare e finestre rosse per stare alla larga.
- Pianifica le sessioni intorno a ore/giorni statisticamente favorevoli.
- Aggiungi un livello pulito di “quando” a strategie discrezionali e sistematiche.
⚙️ Come funziona
- Guarda avanti su una finestra che scegli e riassume come il prezzo tende a comportarsi in quella finestra.
- Raggruppa i risultati in intervalli temporali (Mese / Giorno della Settimana / Ora) e rispetta il tuo fuso orario.
- Applica protezione dagli outlier e un punteggio di forza robusto per intervallo (più dimensione del campione).
- Disegna una mappa di calore bilanciata attorno al neutro usando i tuoi colori Su / Zero / Giù.
👥 A chi è rivolto
- Trader discrezionali — migliore tempistica e dimensionamento per sessione.
- Costruttori di sistemi e bot — un filtro temporale / dimensionamento temporale per strategie.
- Trader di crypto e indici — modelli comportamentali rapidi su giorni/ore.
- Principianti — lettura semplice: più verde = bias più positivo sull’orizzonte scelto.
🚀 Avvio rapido
- Scegli Preset Asset (Forex/Crypto/Indice/Oro).
- Imposta Orizzonte (es., 1 Ora per HOD, 1 Giorno per DOW/Mese).
- Regola Lookback, Minimo Osservazioni e colori.
- Leggi i cluster (diversi riquadri verdi/rossi adiacenti) per i segnali più forti.
ℹ️ La stagionalità non garantisce risultati futuri. È un modello statistico che dipende dal periodo e dalla metodologia. Usa l’indicatore come contesto per le tue regole di ingresso/uscita e gestione del rischio, testa la robustezza su più finestre di lookback e evita di fare affidamento su intervalli con basso n (dimensione del campione).
Riepilogo
The indicator supports multiple asset presets including Forex, Crypto, Indices, and Commodities, and respects the user’s timezone. It applies outlier protection and calculates a robust strength score per time bucket to ensure reliable insights. Users can customize parameters like lookback period, minimum observations, and color schemes.
Atlas is suitable for discretionary traders seeking better timing and sizing, system and bot builders needing a time-based filter or sizing layer, crypto and index traders analyzing behavioral patterns, and beginners looking for a straightforward indication of positive or negative market bias. It provides a statistical context for entry/exit decisions and risk management but should be used alongside other analysis tools.
Recensioni dei clienti
5 | 50 % | |
4 | 50 % | |
3 | 0 % | |
2 | 0 % | |
1 | 0 % |


