
Stochastic RSI PRO
インジケーター
1 購入済
バージョン 1.0、Nov 2025
Windows、Mac
4.7
レビュー: 4
説明
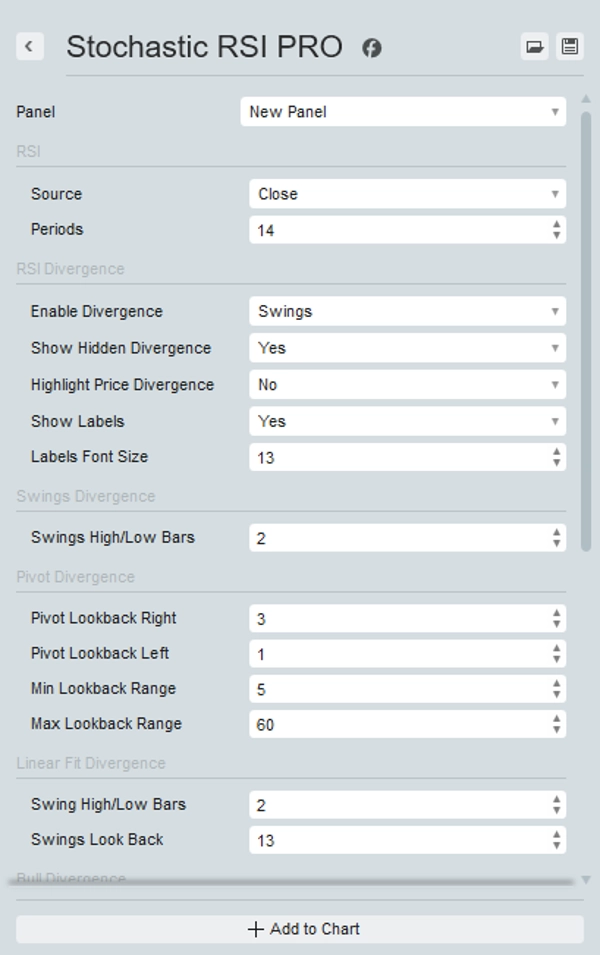
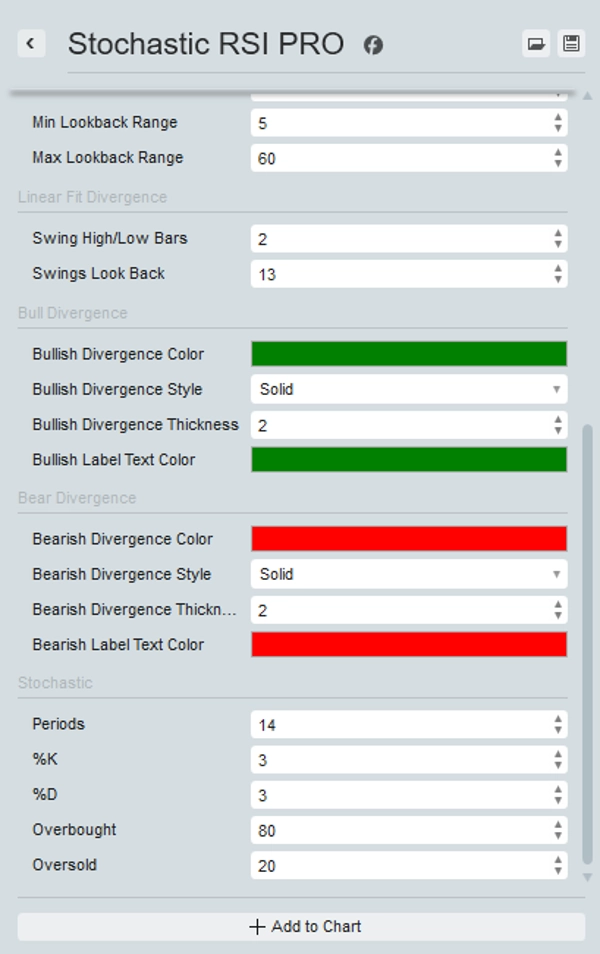
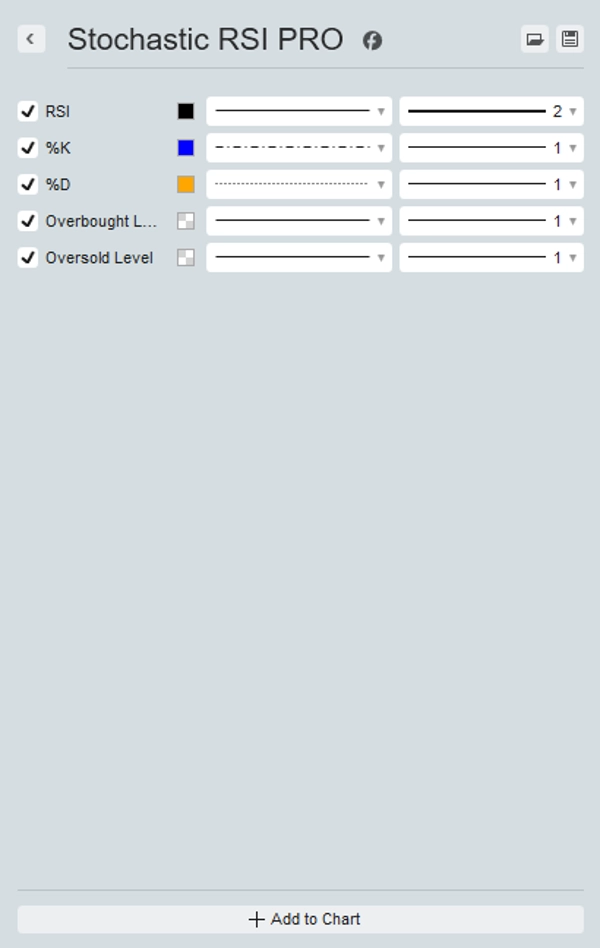
cTrader向けの Stochastic RSI PRO をご紹介します。これは、取引の精度を高めるために設計された Stochastic RSI インジケーターの高度で非常にカスタマイズ可能なバージョンです。
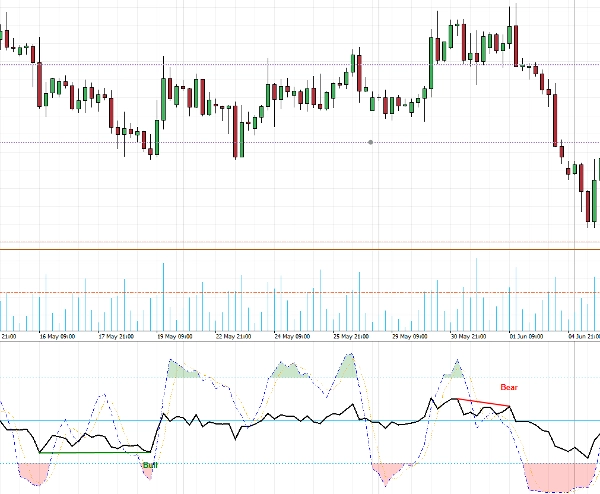
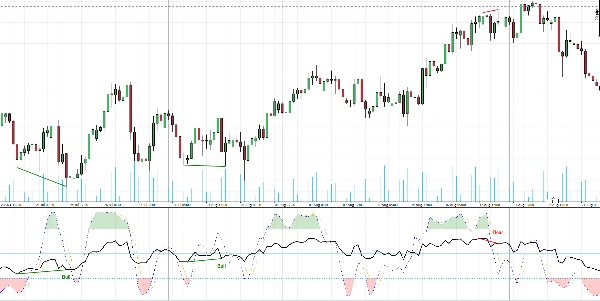
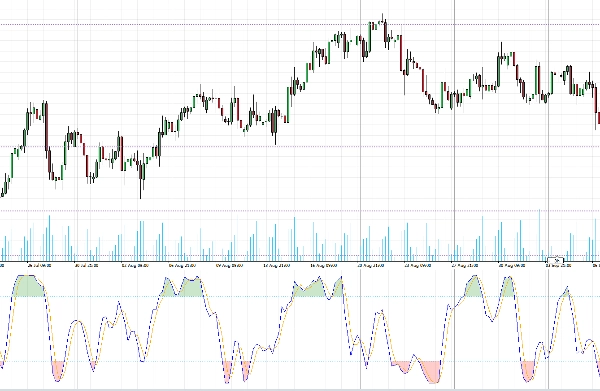
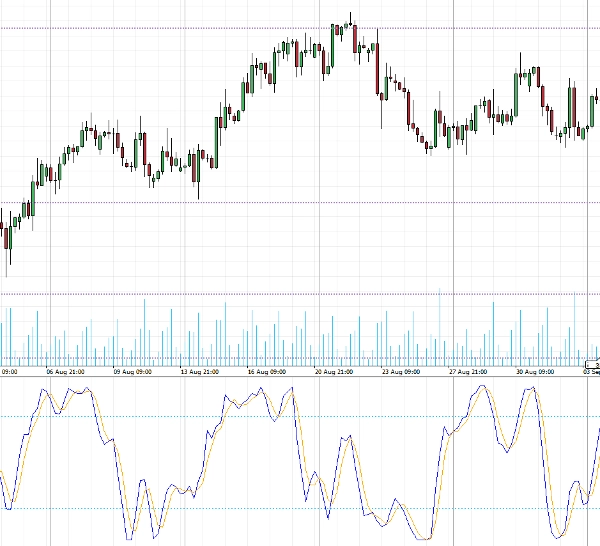
この強力なツールはRSIをStochastic RSIに直接重ね合わせ、市場のモメンタムを包括的に表示します。買われ過ぎおよび売られ過ぎの領域を識別しやすいように異なる色で強調表示します。
Stochastic RSI PROの際立った特徴は、チャート上の通常および隠れた ダイバージェンス を識別し、必要に応じて強調表示できることです。ダイバージェンスの識別には3つの方法から選択できます: スイング、 ピボット、または リニアフィット で、それぞれ取引戦略に合わせてカスタマイズ可能な設定があります。
Stochastic RSI PROで分析と意思決定を高め、目の肥えたトレーダーにとって必須のツールを手に入れましょう。
概要
AIによる概要
Stochastic RSI PRO is an advanced indicator for the cTrader platform that overlays the Relative Strength Index (RSI) onto the Stochastic RSI to provide a detailed view of market momentum. It visually highlights overbought and oversold zones with customizable color coding for easier interpretation. The indicator features the ability to detect and optionally highlight both regular and hidden divergences on price charts. Users can select from three divergence detection methods—Swing, Pivot, or Linear Fit—each offering customizable settings to align with individual trading strategies. This tool supports analysis across multiple markets including Forex, cryptocurrencies, commodities, indices, and stocks, with specific symbol tags such as BTCUSD, EURUSD, GBPUSD, XAUUSD, NAS100, and USDJPY. Stochastic RSI PRO is designed to enhance precision in trade analysis by combining momentum indicators and divergence signals in a single, customizable interface.
インジケーターのプロフィール
カスタマーレビュー
4.7
レビュー: 4
5 | 75 % | |
4 | 25 % | |
3 | 0 % | |
2 | 0 % | |
1 | 0 % |
カスタマーレビュー
February 25, 2026
Stochastic RSI PRO adds serious depth to the classic StochRSI by overlaying RSI and offering three divergence detection modes (Swing, Pivot, Linear Fit). Signals are clean on M5-H4, with the best structure on H1 and above. Flexible, customizable and practical for momentum and divergence-based strategies. A solid upgrade over standard StochRSI.
November 25, 2025
November 17, 2025
the part worth keeping is the trade idea gets a short cooling period. It should not be treated as the full answer.
November 13, 2025
What stood out was the opening read should not drive the only input, and It needs a boring test before bigger size.
ディスカッション
よくあるご質問
BTCUSD
Forex
Signal
Indices
EURUSD
Commodities
GBPUSD
NZDUSD
RSI
Prop
Scalping
Crypto
Stocks
XAUUSD
NAS100
USDJPY
cTrader Storeで入手可能な取引ボット、インジケーター、プラグインなどの商品は、第三者の開発者が提供するものであり、情報と技術の取得のみを目的としてご利用いただけます。cTrader Storeはブローカーではなく、投資助言や個人的な推奨を行うことも、将来のパフォーマンスを保証することもありません。


価格
登録日 25/09/2025
25
販売
333
無料インストール