


Beschreibung
BUBBLEXRAY — DAS ULTIMATIVE BLASENVOLUMEN-RÖNTGEN FÜR CTRADER (VERSION 🇧🇷 UNTEN)
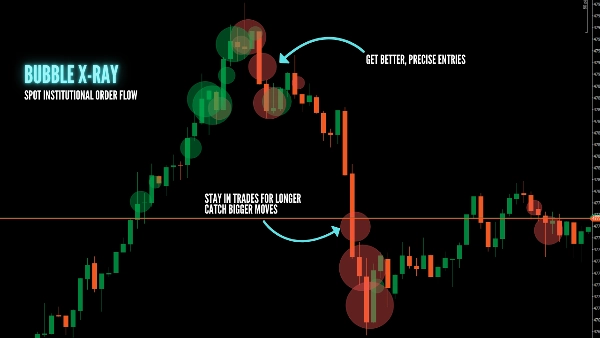
Erkennen Sie, wo das echte Geld bewegt wird. BubbleXRay identifiziert Volumenspitzen und stellt sie als proportionale Blasen direkt auf Ihrer Kursbewegung dar. Zeigt die kumulative Volumendifferenz (CVD) als integrierten Indikator an, ohne Ihr Chart zu überladen oder zu verschmutzen. Kein Rätselraten mehr – sehen Sie institutionelle Spuren in dem Moment, in dem sie entstehen.
✅ WARUM BUBBLEXRAY VERWENDEN?
- Sofortige Aktivitätsspitzen: Blasen bilden sich in dem Moment, in dem eine Hochvolumenkerze schließt.
- Institutionelle Spuren: Große Blasen auf Schlüsselbereichen zeigen, wo große Akteure aktiv sind.
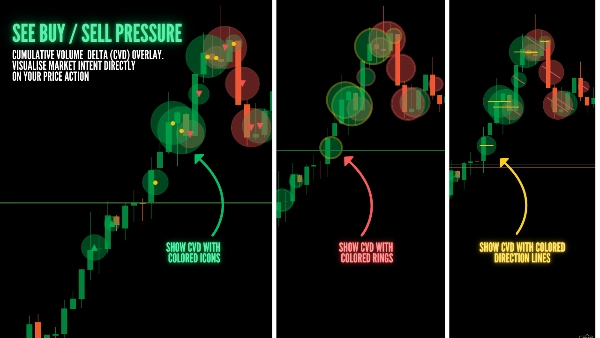
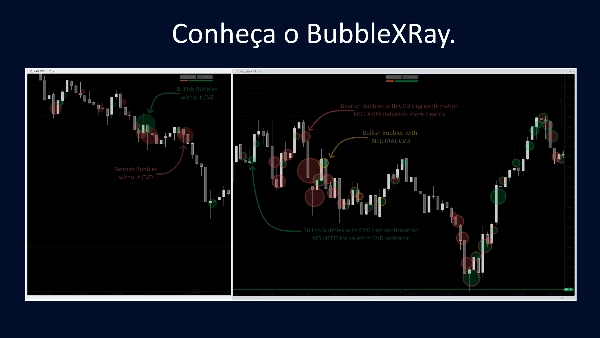
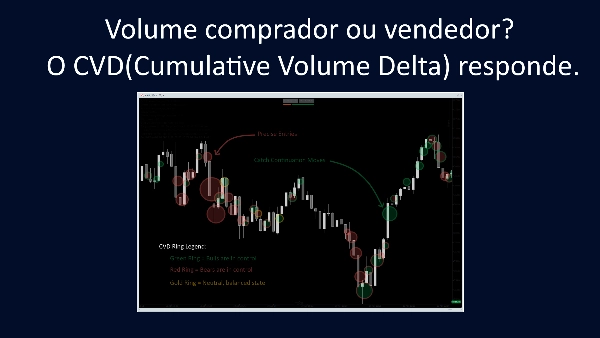
- CVD-Intelligenz: Integrierte kumulative Volumendifferenz zeigt, ob der Anstieg Kauf- oder Verkaufsdruck war.
- Automatische Skalierung: Das rollierende Perzentilfenster passt sich jeder Marktbedingung an (Trend oder Seitwärtsbewegung).
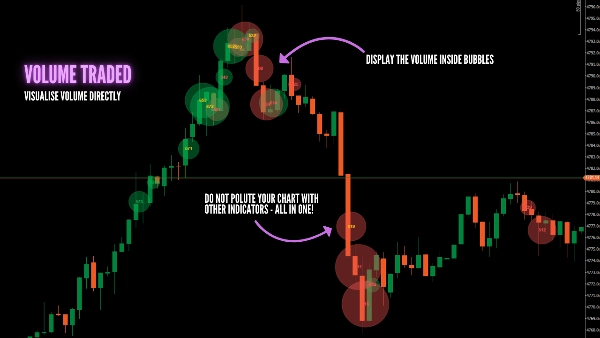
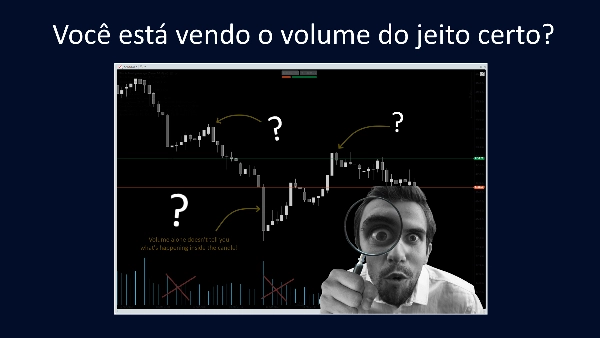
- Preisverankert: Volumen wird auf dem genauen Preisniveau angezeigt, nicht versteckt in einem Unterfenster-Histogramm.
Voreinstellung Beispiel: Gold (XAUUSD) - 1M Chart
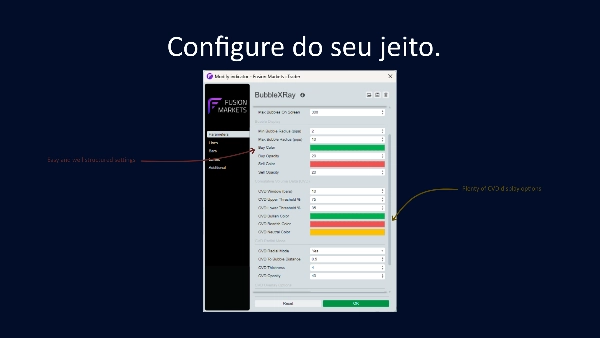
- Volumen-Perzentil-Schwelle: 50
- Perzentilfenster (Kerzen): 250
- Max. Blasen auf dem Bildschirm: 20
- Min. Blasenradius (Pips): 5 ➡ (Beispiel für EUR/USD: 0,1)
- Max. Blasenradius (Pips): 20 ➡ (Beispiel für EUR/USD: 0,8)
- CVD Rollierender Zeitraum (Kerzen): 10
- CVD Steigungs-Rückblick (Kerzen): 7
- CVD Flach-Faktor: 1,8
- CVD Radialmodus: Nein
- CVD Abstand zur Blase: 0,5
- CVD Dicke: 4
- CVD Deckkraft: 40
- CVD Überlagerungsoptionen: Nein
- Debug-Modus: Nein
📺 SEHEN SIE DAS TUTORIAL & TRETTEN SIE DER COMMUNITY BEI:
(Bitte stellen Sie Ihre Fragen/Supportanfragen in den Videokommentaren, um unserer Community beim Wachsen zu helfen!)
🛠️ HAUPTMERKMALE:
- Proportionale Größenanpassung: Die Blasengröße skaliert linear mit dem Volumen.
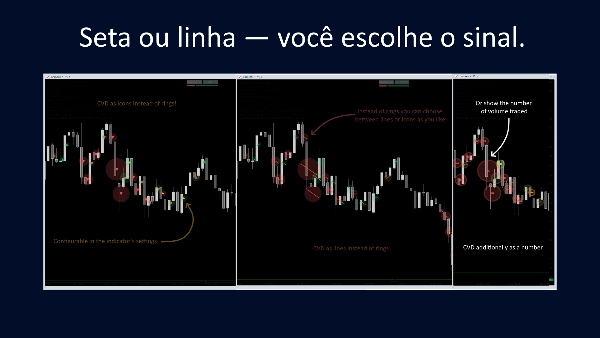
- Doppelte Bestätigung: Kombinieren Sie den Radialring und den Überlagerungspfeil für einen tieferen CVD-Kontext.
- Keine Konfiguration: Wählt automatisch den besten Datenfeed-Zeitrahmen für Ihr Chart aus.
- Saubere Benutzeroberfläche: Konfigurierbare Deckkraft und Anzeigegrenzen, um Ihre Charts professionell zu halten.
🇧🇷 BUBBLEXRAY — O RAIO-X DE VOLUME DEFINITIVO PARA CTRADER
Identifique onde o "Smart Money" está atuando. O BubbleXRay marca picos de alto volume com bolhas proporcionais diretamente no preço. Exiba a variação acumulada do volume (CVD) integrada em um único indicador, sem sobrecarregar ou poluir seu gráfico.Chega de dúvidas: veja o rastro institucional no momento em que ele ocorre.
✅ POR QUE USAR O BUBBLEXRAY?
- Picos de Atividade Instantâneos: As bolhas surgem assim que uma barra de alto volume fecha.
- Rastros Institucionais: Bolhas grandes em níveis-chave revelam a atuação de grandes players.
- Inteligência CVD: O Delta de Volume Acumulado integrado mostra se a pressão foi de Compra ou Venda.
- Auto-Ajustável: O sistema de percentil se adapta a qualquer mercado (Tendência ou Lateralização).
- Ancorado ao Preço: O volume é exibido no nível exato da ação, não escondido em histogramas inferiores.
📺 ASSISTA AO TUTORIAL E TIRE SUAS DÚVIDAS:
(Por favor, poste suas dúvidas e pedidos de suporte nos comentários do vídeo acima, assim ajudamos ao máximo de pessoas!)
🛠️ DESTAQUES TÉCNICOS:
- Tamanho Proporcional: O raio da bolha escala conforme a magnitude do volume.
- Confirmação Dupla: Use o Anel Radial e a Seta Interna para um contexto profundo de CVD.
- Configuração Zero: Seleciona automaticamente o melhor timeframe de dados para seu gráfico.
- Interface Limpa: Opacidade e limites de exibição configuráveis para manter seu setup profissional.
Zusammenfassung
Diskussion
Kundenbewertungen
5 | 25 % | |
4 | 50 % | |
3 | 25 % | |
2 | 0 % | |
1 | 0 % |

Häufig gestellte Fragen (FAQ)







Preis