
session indicator
Indikator
7 käufe
Version 1.0, May 2025
Windows, Mac
4.3
Bewertungen: 3
Beschreibung
Visualisieren Sie wichtige Marktsitzungen + Hoch-/Tiefststände mit Präzision
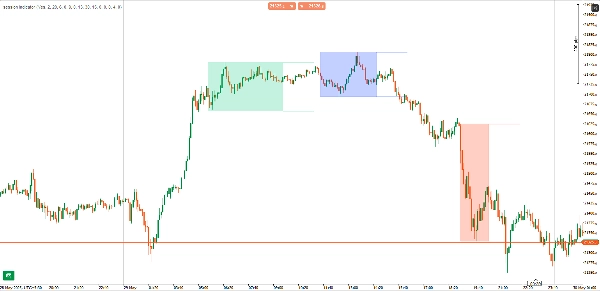
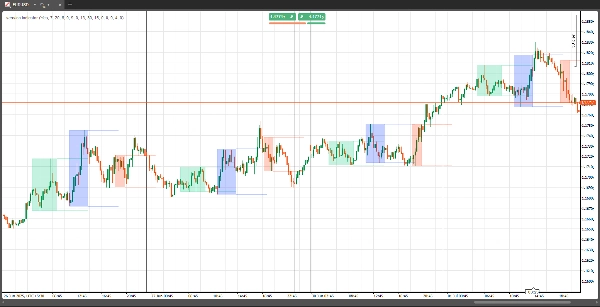
Der Trading Sessions Indikator hebt die wichtigsten Handelssitzungen hervor — London, New York und Tokio — direkt in Ihrem Chart. Egal, ob Sie Scalper oder Swing-Trader sind, zu wissen, wann die Volatilität ansteigt oder abnimmt, ist entscheidend. Dieses Tool bietet Ihnen diesen Vorteil mit Klarheit.
✅ Hauptmerkmale:
- Sitzungsrechtecke: Heben Sie jede Sitzung visuell mit optionalen schattierten Kästchen hervor
- Hoch-/Tief-Linien: Zeichnen Sie Sitzungs-Hochs und -Tiefs mit anpassbarer Verlängerungslänge
- Historische Ansicht: Zeigen Sie Sitzungsdaten für den aktuellen Tag oder eine beliebige Anzahl von vorherigen Tagen
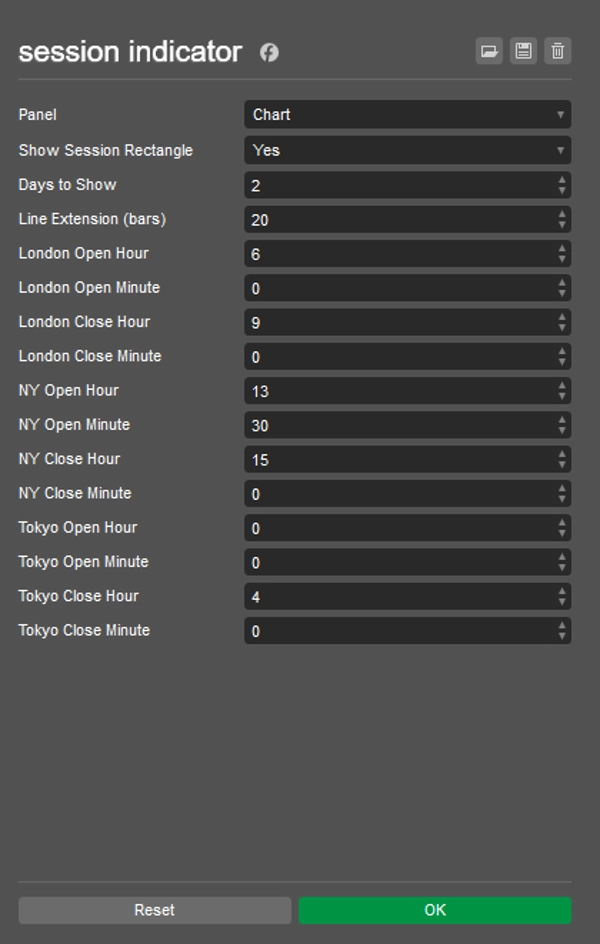
- Vollständig anpassbar: Legen Sie Sitzungsstart/-endzeiten fest, schalten Sie Rechtecke ein/aus und definieren Sie, wie weit Linien verlängert werden
- Unterstützung mehrerer Zeitrahmen: Funktioniert in allen Chart-Zeitrahmen
🔧 Parameter:
- Sitzungszeiten: Benutzerdefinierte Start-/Endzeit für London, NY und Tokio
- Rechteck anzeigen: Schalten Sie schattierte Sitzungsfelder ein/aus
- Anzuzeigende Tage: Anzahl der historischen Tage zur Anzeige der Sitzungsdaten
- Linienverlängerungsbalken: Steuern Sie, wie weit die Hoch-/Tief-Linien der Sitzung im Chart verlängert werden
🧠 Warum verwenden?
Das Verständnis von volatilitätsbasierten Mustern der Sitzungen ist ein Grundpfeiler des institutionellen Handels. Dieser Indikator hilft Ihnen:
- Einstiege und Ausstiege zeitlich um wichtige Liquiditätszonen
- Sitzungs-Hochs und Tiefs für Ausbruchs- oder Umkehrstrategien identifizieren
- Visuell Sitzungsüberschneidungen trennen (z. B. London–NY)
Zusammenfassung
KI-Zusammenfassung
The Session Indicator is a charting tool designed to highlight key global trading sessions—London, New York, and Tokyo—directly on trading charts. It visually marks each session with optional shaded rectangles and plots session high and low price levels, with customizable line extension lengths. Users can view session data for the current day or multiple previous days, supporting analysis across various timeframes.
Key features include full customization of session start and end times, toggling of session rectangles, and control over how far high/low lines extend. The indicator works on all chart timeframes and helps traders identify volatility patterns associated with institutional trading sessions.
This tool aids in timing entries and exits around key liquidity zones, recognizing session highs and lows for breakout or reversal strategies, and visually distinguishing overlapping sessions such as London-New York. It supports markets including Forex, indices, and major symbols like NAS100. The indicator outputs visual signals based on market structure concepts and is suitable for traders employing reversal strategies.
Indikatorprofil
Indikatorkategorie
Marktstruktur (SMC)
Ausgabetyp
Visualisierung
Datenanforderungen
Nur Balken
Unterstützte Signale
Wendepunkt
Kundenbewertungen
4.3
Bewertungen: 3
5 | 67 % | |
4 | 0 % | |
3 | 33 % | |
2 | 0 % | |
1 | 0 % |
Kundenbewertungen
June 2, 2025
Useful setup helper for traders who care about timing windows. It gives value around session timing, but the value depends on the trader's schedule. I would compare Asia range, London break and New York continuation before trusting it. The tool is most useful when it keeps the trader out of dead hours.
June 1, 2025
June 1, 2025
Decent trade support for session timing. it helps match setups with active market hours, especially when used for planning trades around active sessions. The session view is useful for London and New York, especially when checking the first 60 minutes. The tool is most useful when it keeps the trader out of dead hours.
Diskussion
Häufig gestellte Fragen (FAQ)
Prop
Forex
Indices
Fair Value Gap
SMC
NAS100
Über den cTrader Store verfügbare Produkte, einschließlich Handelsbots, Indikatoren und Plugins, werden von externen Entwicklern bereitgestellt und nur zu Informations- und technischen Zugriffszwecken verfügbar gemacht. cTrader Store ist kein Broker und erbringt keine Anlageberatung, persönlichen Empfehlungen oder eine Garantie für zukünftige Performance.


![„[Hamster-Coder] Moving Average MTF“-Logo](https://cdn.ctrader.com/image/webp/b11b98b1-194d-4b8e-b00e-d611826ad159_31226)


Preis
Seit 30/05/2025
40
Verkäufe