Descrizione
Session & Kill Zone Highlighter è un indicatore visivo professionale progettato per i trader che seguono la metodologia ICT/SMC o semplicemente vogliono sapere esattamente quale sessione di mercato è attiva in un dato momento.
🔱 COSA FA
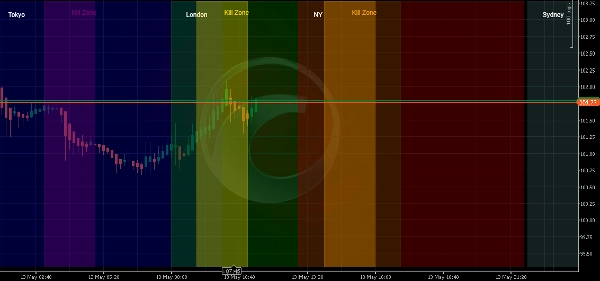
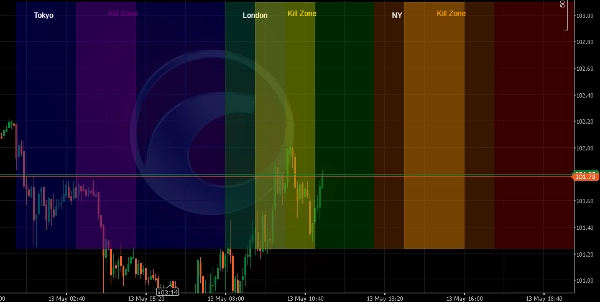
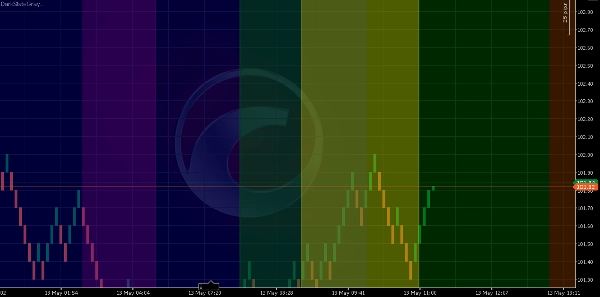
Questo indicatore disegna rettangoli colorati trasparenti direttamente sul tuo grafico per tutte le principali sessioni forex:
• Sydney Session (UTC: 22:00 - 07:00)
• Tokyo Session (UTC: 00:00 - 09:00)
• London Session (UTC: 07:00 - 16:00)
• New York Session (UTC: 12:00 - 21:00)
Inoltre, evidenzia le ICT Kill Zone più liquide:
• Asian Kill Zone (02:00 - 04:00 UTC)
• London Kill Zone (08:00 - 10:00 UTC)
• New York Kill Zone (13:00 - 15:00 UTC)
🔱 CARATTERISTICHE PRINCIPALI
✔ Funziona con TUTTI i tipi di grafico: Renko, Candlestick, Linea, Tick, Range, Volume, Point & Figure, Kagi
✔ Tempi e colori delle sessioni completamente personalizzabili
✔ Opacità regolabile per sessioni e kill zone (da 0.1 a 0.9)
✔ Etichette opzionali per le sessioni e linee di confine verticali
✔ Ridisegna automaticamente ogni giorno
✔ Gestisce sessioni notturne (es. Sydney)
🔱 PERCHÉ TI SERVE
• Smetti di indovinare quale mercato è attivo
• Identifica a colpo d'occhio le ore di trading più liquide
• Applica la metodologia ICT con conferma visiva
• Risparmia tempo – niente più disegni manuali di linee
• Funziona su qualsiasi timeframe e strumento (Forex, Indici, Crypto, Commodities, Azioni)
🔱 PREZZI E PROVA
• Prezzo regolare: 19 $ USD
• Prova gratuita completamente funzionale di 7 giorni (nessuna funzione limitata)
• Pagamento una tantum, licenza a vita
🔱 NOTE IMPORTANTI
• Questo indicatore è progettato per essere applicato direttamente al pannello del grafico. Anche se selezioni 'Nuovo pannello' nelle proprietà, l'indicatore disegnerà comunque correttamente sul grafico.
• Tutti gli orari sono in UTC. L'indicatore gestisce automaticamente i cambi di giorno e le sessioni notturne.
• Dopo la scadenza della prova di 7 giorni, l'indicatore smetterà di funzionare e mostrerà un messaggio. Acquista la versione completa per continuare a usarlo.
⚠️ DISCLAIMER: Il trading comporta il rischio di perdite. Le performance passate non garantiscono risultati futuri. Questo indicatore è uno strumento visivo progettato per aiutare i trader a identificare le sessioni di mercato. Non genera segnali di trading. Usa sempre una corretta gestione del rischio.
📝 SUPPORTO: Per domande, richieste di funzionalità o supporto, contatta lo sviluppatore tramite il cTrader Store.
Buon trading con Session & Kill Zone Highlighter!
Riepilogo
The indicator supports all chart types, including Renko, Candlestick, Line, Tick, Range, Volume, Point & Figure, and Kagi. Users can customize session times, colors, and opacity levels (0.1 to 0.9), and enable optional session labels and vertical boundary lines. It automatically redraws daily and correctly handles overnight sessions such as Sydney.
This tool aids traders in identifying active market sessions and the most liquid trading hours at a glance, facilitating application of the ICT/SMC trading methodology. It works on any timeframe and instrument type, including Forex, Indices, Crypto, Commodities, and Stocks. All times are in UTC, and the indicator is applied directly to the chart panel.
Recensioni dei clienti
5 | 100 % | |
4 | 0 % | |
3 | 0 % | |
2 | 0 % | |
1 | 0 % |