
Parabolic RSI Alert V1
Indicatore
3 acquisti
Versione 1.0, Aug 2025
Windows, Mac
4.5
Recensioni: 2
Descrizione
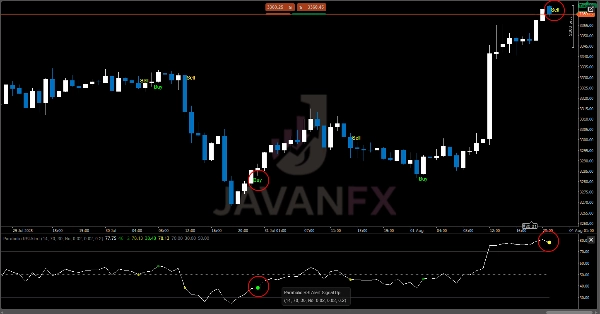
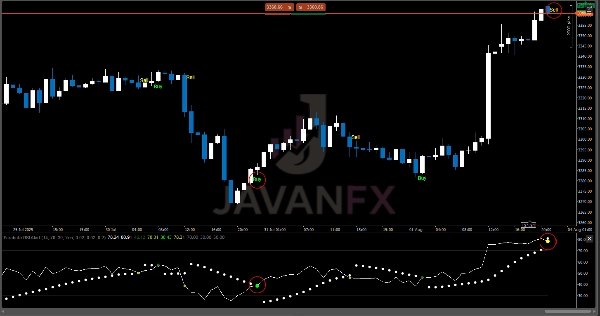
Il Parabolic RSI Alert è un indicatore potente che combina la precisione del Relative Strength Index (RSI) con le capacità dinamiche di trend-following di un Parabolic SAR personalizzato. Questa fusione unica aiuta i trader a identificare punti di inversione ad alta probabilità con segnali visivi chiari e avvisi in tempo reale.
Note d'uso:
- L'indicatore funziona meglio su timeframe da 1H in su
- Segnali forti si verificano quando le inversioni avvengono in zone di ipercomprato/ipervenduto
- Segnali regolari appaiono quando le inversioni avvengono fuori dalle zone estreme
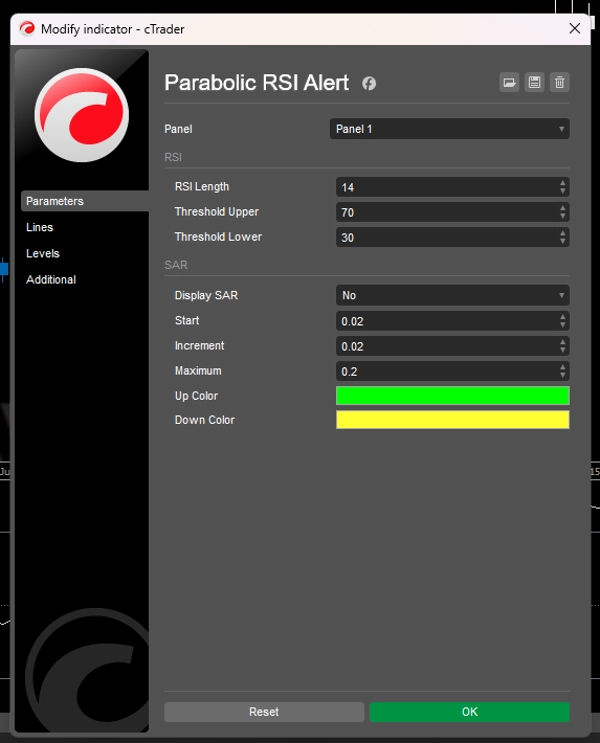
- I punti SAR vengono tracciati solo quando
Display SARè abilitato - Combinare con price action e altri indicatori per confermare i punti di entrata e uscita (opzionale).
Ideale per i trader che:
- Vogliono ridurre il ritardo nell'analisi RSI tradizionale
- Hanno bisogno di avvisi visivi e sonori chiari per entrate tempestive
- Preferiscono segnali meccanici piuttosto che una lettura soggettiva del grafico
Riepilogo
Riepilogo AI
The Parabolic RSI Alert indicator integrates the Relative Strength Index (RSI) with a custom Parabolic SAR to identify high-probability trend reversal points. It provides clear visual signals and real-time alerts to assist traders in timely decision-making. Designed for use on 1-hour and higher timeframes, the indicator highlights strong reversal signals particularly when they occur in overbought or oversold zones, while also signaling less extreme reversals. Parabolic SAR points are displayed when the corresponding option is enabled. This tool aims to reduce lag commonly associated with traditional RSI analysis and offers mechanical, objective signals supported by both visual and audible alerts. It is suitable for traders who prefer systematic entry and exit cues and can be combined with price action or other indicators for confirmation.
Profilo indicatore
Recensioni dei clienti
4.5
Recensioni: 2
5 | 50 % | |
4 | 50 % | |
3 | 0 % | |
2 | 0 % | |
1 | 0 % |
Recensioni dei clienti
October 10, 2025
Smooth combo! 🎯 Parabolic RSI Alert mixes momentum & trend perfectly — clean entries, fewer fakeouts. Great hybrid for swing or intraday setups.
August 18, 2025
Discussioni
Domande frequenti
I prodotti disponibili tramite cTrader Store, inclusi bot di trading, indicatori e plugin, sono forniti da sviluppatori terzi e resi disponibili esclusivamente a scopo informativo e di accesso tecnico. cTrader Store non è un broker e non fornisce consulenze in materia di investimento, raccomandazioni individualizzate o garanzie di risultati futuri.


Prezzo
Da 14/07/2025
60
Vendite