
Zero Lag LSMA
Indicatore
6 acquisti
Versione 1.0, Aug 2025
Windows, Mac
4.6
Recensioni: 3
Descrizione
Il Zero Lag LSMA (Least Squares Moving Average) è un indicatore tecnico all'avanguardia progettato per i trader che cercano una maggiore reattività e precisione nell'analisi delle tendenze. A differenza delle medie mobili tradizionali che seguono con ritardo l'azione del prezzo, minimizza il ritardo applicando un doppio processo di regressione lineare, rendendolo ideale per identificare la direzione della tendenza e potenziali inversioni in tempo reale. Questo indicatore è perfetto per forex, azioni, materie prime e altri mercati.
Caratteristiche principali
- Prestazioni Zero-Lag: Riduce il ritardo insito nelle medie mobili tradizionali, fornendo segnali più rapidi per i cambiamenti di tendenza.
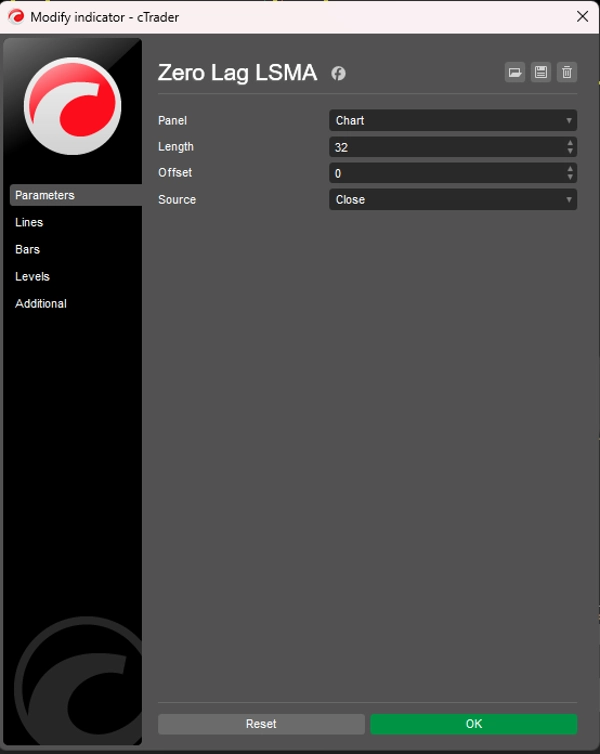
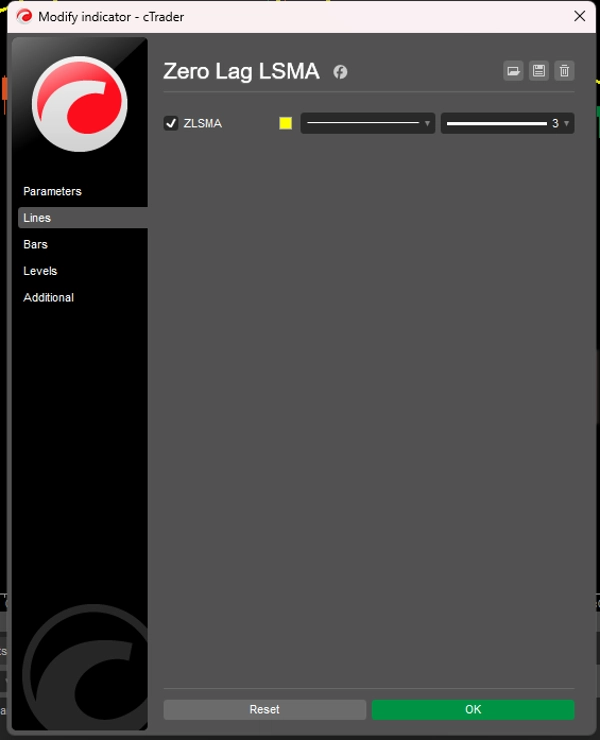
- Parametri Personalizzabili: Regola la lunghezza, lo spostamento e la fonte del prezzo (Open, High, Low, Close) per adattarsi alla tua strategia di trading.
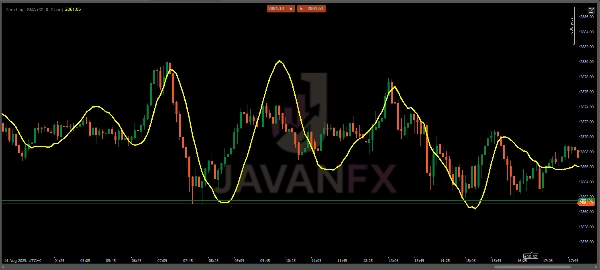
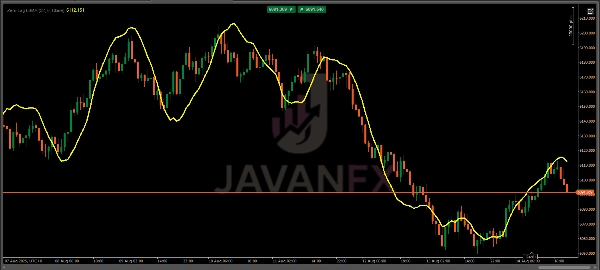
- Visivamente Intuitivo: Visualizzato come una linea gialla liscia sovrapposta al grafico dei prezzi per una facile interpretazione.
- Applicazione Versatile: Adatto per scalping, day trading, swing trading e strategie a lungo termine su vari timeframe.
Come Usare
- Identificazione della Tendenza:
-
- Quando la linea ZLSMA è inclinata verso l'alto, indica una tendenza rialzista.
- Un'inclinazione verso il basso suggerisce una tendenza ribassista.
- Un movimento piatto o irregolare può indicare consolidamento o assenza di tendenza.
- Segnali di Entrata/Uscita:
-
- Segnale di Acquisto: Entra in una posizione long quando il prezzo supera la linea ZLSMA, specialmente dopo una tendenza rialzista confermata.
- Segnale di Vendita: Entra in una posizione short quando il prezzo scende sotto la linea ZLSMA durante una tendenza ribassista.
- Segnale di Uscita: Considera di uscire quando il prezzo attraversa nuovamente la ZLSMA o quando la linea si appiattisce, indicando una potenziale inversione di tendenza.
- Conferma:
-
- Combina ZLSMA con altri indicatori (es. RSI, MACD) o livelli di supporto/resistenza per confermare i segnali ed evitare falsi breakout.
- Usalo su timeframe più alti (H1, H4, D1) per segnali di tendenza più forti o su timeframe più bassi (M5, M15) per scalping.
Strategie di Trading
- Trend Following: Usa ZLSMA per cavalcare tendenze forti entrando sui ritracciamenti verso la linea ZLSMA nella direzione della tendenza.
- Trading di Inversione: Cerca divergenze di prezzo dalla linea ZLSMA combinate con pattern di candele (es. pin bar, engulfing) per setup di inversione.
- Trading di Breakout: Monitora i breakout del prezzo sopra/sotto la ZLSMA durante periodi di alta volatilità per potenziali punti di entrata.
Consigli per un Uso Ottimale
- Regola la Lunghezza in base alle Condizioni di Mercato: Usa una lunghezza più corta (es. 10-20) per mercati più veloci o scalping, e una lunghezza più lunga (es. 50-100) per tendenze più fluide su timeframe più alti.
- Testa su Conto Demo: Prima di usare in trading reale, testa la ZLSMA su un conto demo per comprendere il suo comportamento nei mercati preferiti.
- Evita l'Overtrading in Mercati Laterali: ZLSMA funziona meglio in mercati con tendenza; usa filtri aggiuntivi (es. ADX) per evitare falsi segnali in mercati laterali.
Riepilogo
Riepilogo AI
The Zero Lag LSMA (Least Squares Moving Average) is a technical indicator designed to enhance trend analysis by minimizing the lag typical of traditional moving averages. It uses a double linear regression process to provide faster and more responsive signals, making it suitable for real-time identification of trend direction and potential reversals. The indicator is applicable across various markets including forex, stocks, and commodities.
Key features include customizable parameters such as length, offset, and price source (Open, High, Low, Close), allowing adaptation to different trading strategies. It displays as a smooth yellow line overlaid on the price chart for clear visual interpretation. The indicator supports multiple trading styles and timeframes, from scalping to long-term strategies.
Traders use the Zero Lag LSMA to identify trends by observing the slope of the line: upward for bullish trends, downward for bearish, and flat for consolidation. Entry and exit signals are generated when price crosses the LSMA line, with additional confirmation recommended through other indicators or support/resistance levels. The indicator supports trend following, reversal, and breakout trading strategies, with adjustable settings to optimize performance under varying market conditions.
Profilo indicatore
Recensioni dei clienti
4.6
Recensioni: 3
5 | 67 % | |
4 | 33 % | |
3 | 0 % | |
2 | 0 % | |
1 | 0 % |
Recensioni dei clienti
October 10, 2025
Zero lag, full clarity ⚡ LSMA tracks price action like a scalpel — sharp, fast, and smooth. Great trend filter for any timeframe!
August 27, 2025
The only reason it stays interesting is the setup needs less second guessing. A normal demo run is enough to see the weak spots.
August 16, 2025
Not bad if the rules are already clear. Spread and slippage need a line in the notes.
Discussioni
Domande frequenti
I prodotti disponibili tramite cTrader Store, inclusi bot di trading, indicatori e plugin, sono forniti da sviluppatori terzi e resi disponibili esclusivamente a scopo informativo e di accesso tecnico. cTrader Store non è un broker e non fornisce consulenze in materia di investimento, raccomandazioni individualizzate o garanzie di risultati futuri.


Prezzo
Da 14/07/2025
60
Vendite