
Açıklama
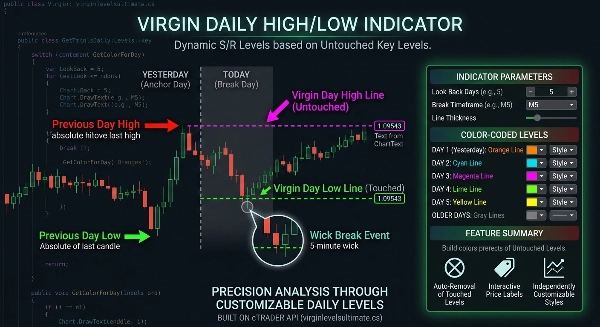
Önceki Günün Yüksek / Düşük – Virgin Levels Ultimate
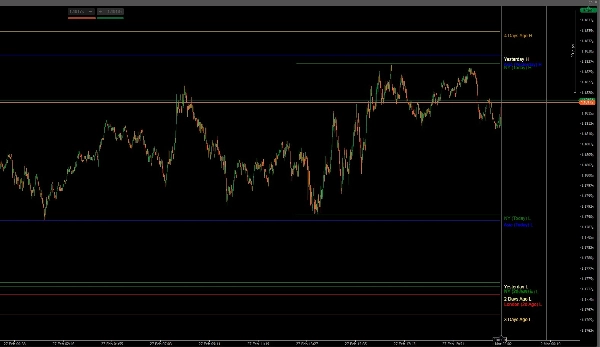
Virgin Levels Ultimate, önceki işlem günlerinden kullanılmamış yüksek ve düşük seviyeleri otomatik olarak çizen ve fiyat bu seviyeleri kırana kadar grafiğinizde tutan hassas bir seviye takip göstergesidir.
Dokunulmamış likidite seviyelerinin fiyat için mıknatıs görevi gördüğünü anlayan traderlar için tasarlanmış bu araç, kırılma ve dönüş işlemleri için size temiz, yapılandırılmış bir çerçeve sunar.
Şimdi Asya, Londra ve New York seanslarının yüksek/düşük seviyeleri ile genişletildi, ayrıca Önceki Haftalık ve Aylık seviyeler eklenerek tam bir çok zaman dilimli likidite haritası oluşturuldu.
Forex, endeksler, altın ve kripto için tasarlanmıştır — tüm zaman dilimlerinde.
Ana likiditeyi işlem yapın. Hassasiyetle işlem yapın.
⚙ Temel Motor
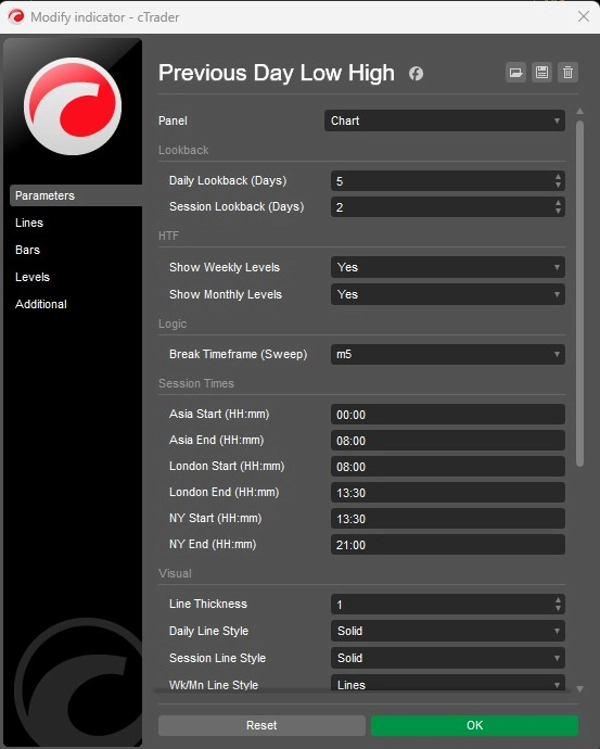
- Önceki günlük yüksek ve düşüklerin otomatik tespiti
- Özelleştirilebilir günlük geriye dönük dönem (birden fazla geçmiş günü takip etme)
- Asya, Londra ve New York seansı yüksek/düşük tespiti
- Seans geriye dönük kontrolü (birden fazla önceki seansı takip etme)
- Önceki Haftalık Yüksek / Düşük (isteğe bağlı)
- Önceki Aylık Yüksek / Düşük (isteğe bağlı)
- Seviyeler yalnızca sonraki geçerli işlem döneminden itibaren aktif olur
- Seviye dokunulduğunda otomatik kaldırma (karmaşa yok)
- Seçilebilir daha düşük zaman dilimine dayalı kırılma tespiti
- Gerçek zamanlı seviye doğrulaması
📊 Virgin Seviye Mantığı
- Yalnızca dokunulmamış (virgin) yüksek ve düşükleri çizer
- Günlük, Seans, Haftalık ve Aylık seviyeler net şekilde ayrılmıştır
- Çok günlük takip (1. Gün'den 5+ Gün'e kadar)
- Seans takibi (Bugün, Dün, özel geriye dönük)
- Eski günler görsel olarak ayırt edilir
- Dinamik destek ve direnç haritalaması
- Likidite bazlı kırılma çerçevesi
- Çok zaman dilimli uyum yapısı
🕒 Akıllı Kırılma Tespiti
- Seçilebilir kırılma zaman dilimi (örneğin, M5, M15, vb.)
- Seviye geçersiz kılma için gün içi hassasiyet
- Geçerli aktivasyon zamanından itibaren yüksek/düşük taraması
- Günlük, Seans, Haftalık ve Aylık seviyelerde çalışır
- Onaylanmış dokunuş sonrası hemen çizimi durdurur
- Temiz grafik mantığı — geçmiş aşım yok
🎨 Tam Özelleştirme
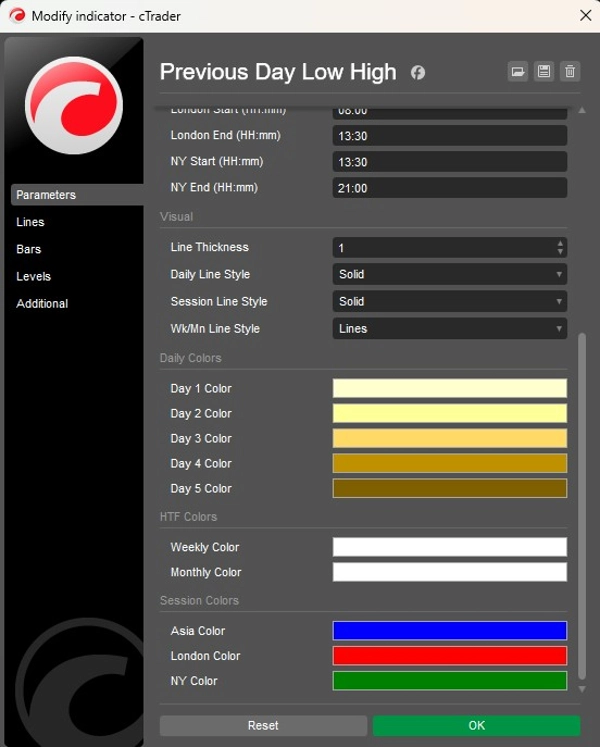
- Her günlük geriye dönük için bağımsız renk kontrolü
- Asya, Londra ve New York seansları için özel renkler
- Haftalık ve Aylık seviyeler için ayrı renkler
- Ayarlanabilir çizgi stilleri (Günlük / Seans / HTF)
- Özel kalınlık ayarları
- Akıllı yığma ile otomatik fiyat etiketleri (çakışma yok)
- Minimal, profesyonel grafik görünümü
🎯 İdeal Kullanım Alanları
- Likidite süpürme traderları
- Kırılma ve sahte kırılma traderları
- SMC / ICT tarzı traderlar
- Seans bazlı traderlar (Asya, Londra, NY)
- Gün içi ve swing traderları
- Prop firması kural tabanlı sistemleri
- Çok varlıklı traderlar (Forex, endeksler, metaller, kripto)
Özet
Key features include automatic detection and plotting of prior highs and lows, customizable lookback periods for days and sessions, real-time validation, and automatic removal of levels once touched to reduce chart clutter. It visually distinguishes older levels and separates daily, session, weekly, and monthly levels with independent color and style customization. The tool supports dynamic support and resistance mapping and provides a liquidity-based breakout framework suitable for Forex, indices, gold, cryptocurrencies, and other markets.
This indicator is suitable for liquidity sweep traders, breakout and fakeout strategies, smart money concept (SMC) and institutional trading (ICT) styles, session-based trading, intraday and swing trading, prop firm rule-based systems, and multi-asset trading. It offers a professional, minimal chart appearance with auto price labels and smart stacking.
Müşteri değerlendirmeleri
5 | 100 % | |
4 | 0 % | |
3 | 0 % | |
2 | 0 % | |
1 | 0 % |


