

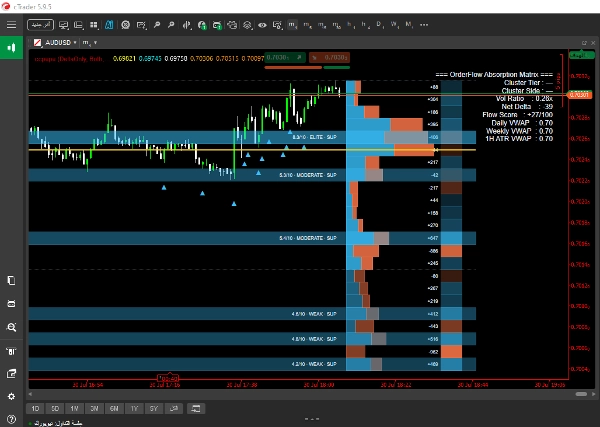
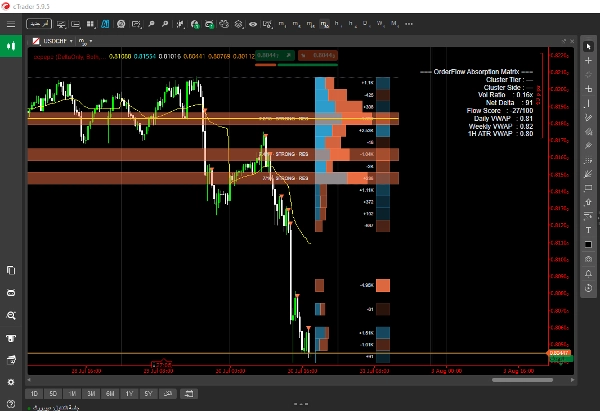
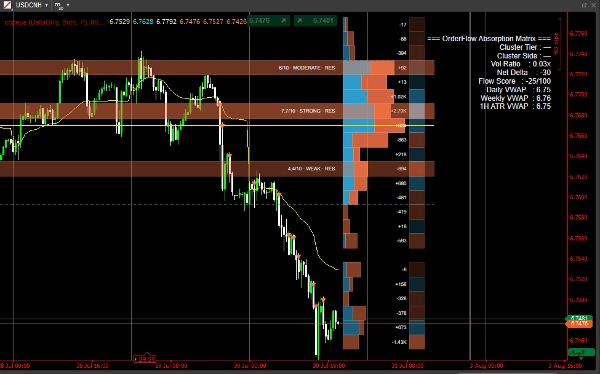
설명
1️⃣ 주문 흐름 및 델타 감지
- 하위 타임프레임(LTF) 드릴링: 지표는 각 현재 바 내에서 하위 타임프레임 캔들 데이터(예: 1분 봉)를 검사하여 다음을 계산합니다:
-
- 순 델타: 매수 및 매도 거래량 간의 순 차이.
- 흡수: 가격을 더 이상 밀어내지 못하는 바 극단에서 거래되는 대량 거래량으로, 대규모 수동 지정가 주문이 시장 유동성을 흡수하고 있음을 신호합니다.
- 고래 프린트 감지: 세 가지 구별된 조회 창(단기, 중기, 장기) 전반에 걸쳐 계산된 동적 백분위수와 사용자 정의 가능한 컨센서스 엔진을 결합하여 진정한 기관 거래량 급증을 분리합니다.
2️⃣ 적응형 거래량 프로필 엔진
- 빈 세분화: 과거 가격 범위(조회 바)를 동일한 수직 가격 빈으로 분할합니다.
- 거래량 분포: 각 빈별 매수 거래량, 매도 거래량 및 델타를 분리하여 차트 오른쪽에 비례하는 수평 프로필 바를 렌더링합니다.
- 동적 타임프레임 처리: 고정된 초 단위 틱에 의존하는 대신, 지표는 실제 바 간격(
GetCurrentBarSpan)을 동적으로 평가합니다. 이는 비표준 타임프레임 및 시장 세션 휴식(예: 주식 시장 야간 갭)에서 프로필 붕괴 또는 선 왜곡을 방지합니다. - 가치 영역 및 POC 계산:
-
- POC(통제점): 가장 높은 거래량 가격 수준을 식별하고 눈에 띄는 앵커 라인으로 강조합니다.
- 가치 영역(VA): 핵심 거래량 비율(예: 70%)을 동적으로 분리하고 가치 영역 최고가(VAH) 및 가치 영역 최저가(VAL)를 그립니다.
3️⃣ 가중 다요인 존 점수 시스템
각 가격 빈은 1에서 10까지 점수를 부여하는 가중 다요인 공식으로 지속적으로 평가됩니다:
점수=w1⋅거래량+w2⋅흡수+w3⋅접촉+w4⋅거부+w5⋅최근성
- 자동 존 프로파일링: 높은 점수 수준(엘리트 또는 강력)은 실시간 숫자 강도 배지와 함께 동적 지지/저항 존으로 차트에 투영됩니다.
4️⃣ 고정 VWAP 신호 및 실행 트리거
- 일, 주, 월의 주요 시간 변동에 고정된 VWAP 벤치마크 라인을 계산합니다.
- 고정 VWAP에 대한 가격 움직임과 높은 거래량 클러스터 트리거를 교차 분석하여 차트에 정밀 진입 화살표를 직접 표시합니다.
5️⃣ 화면 내 분석 대시보드
선택한 차트 모서리에 위치한 깔끔한 실시간 HUD가 시장 상황의 즉각적인 요약을 제공합니다:
- 클러스터 등급: 현재 바 분류(고래, 중간, 소형).
- 클러스터 측면 및 순 델타: 방향성 유동성 편향 및 정확한 델타 수치.
- 거래량 비율: 이동 평균에 대한 현재 거래량.
- 흐름 점수: −100에서 +100까지 범위의 정규화된 모멘텀/주문 흐름 점수.
- VWAP 벤치마크: 활성 VWAP 수준의 실시간 값
요약
AI 요약
OrderFlow Absorption Matrix is an advanced indicator for cTrader that provides detailed order flow and volume profiling to identify institutional trading activity. It analyzes lower timeframe candle data to calculate net delta (buy vs. sell volume) and absorption, highlighting heavy volume at bar extremes where price fails to move further, indicating large passive limit orders. The indicator detects significant volume spikes ("Whale Prints") using dynamic percentiles across multiple lookback windows combined with a consensus engine.
It features an adaptive volume profile engine that segments historical price ranges into equal bins, displaying buy volume, sell volume, and delta per bin with proportional horizontal bars. The profile dynamically adjusts for varying timeframes and market session breaks, calculating key levels such as Point of Control (highest volume price) and Value Area (core volume range).
A weighted multi-factor scoring system continuously evaluates price bins based on volume, absorption, touches, rejections, and recency, projecting high-scoring zones as dynamic support/resistance levels with numeric strength indicators. Anchored VWAP lines are calculated for key time anchors (day, week, month) and combined with volume cluster triggers to plot precise entry signals.
An on-screen analytics dashboard provides real-time summaries including cluster tier classification, directional delta, volume ratios, momentum scores, and VWAP benchmarks, aiding in market condition assessment and trade decision-making.
It features an adaptive volume profile engine that segments historical price ranges into equal bins, displaying buy volume, sell volume, and delta per bin with proportional horizontal bars. The profile dynamically adjusts for varying timeframes and market session breaks, calculating key levels such as Point of Control (highest volume price) and Value Area (core volume range).
A weighted multi-factor scoring system continuously evaluates price bins based on volume, absorption, touches, rejections, and recency, projecting high-scoring zones as dynamic support/resistance levels with numeric strength indicators. Anchored VWAP lines are calculated for key time anchors (day, week, month) and combined with volume cluster triggers to plot precise entry signals.
An on-screen analytics dashboard provides real-time summaries including cluster tier classification, directional delta, volume ratios, momentum scores, and VWAP benchmarks, aiding in market condition assessment and trade decision-making.
지표 프로필
지표 카테고리
통계
출력 유형
필터
데이터 요구 사항
틱 데이터
지원되는 신호
레벨 돌파
레벨 터치
반전
다이버전스
상담
고객 리뷰
0.0
리뷰: 0
고객 리뷰
이 상품에 대한 리뷰가 아직 없습니다. 이미 사용해 보셨나요? 다른 사람들에게 가장 먼저 소개해 주세요!
자주 묻는 질문(FAQ)
Bollinger Bands
Key Levels
Volume
Supply & Demand
VWAP
Support & Resistance
트레이딩 봇, 지표, 플러그인 등 cTrader Store에서 제공되는 상품은 제3자 개발자에 의해 제공되며, 이는 단순히 정보 및 기술적 접근을 목적으로 제공된 것입니다. cTrader Store는 중개인이 아니며, 투자 조언, 개인별 추천 또는 향후 성과에 대한 어떠한 보장도 제공하지 않습니다.
이 작성자의 상품 더 보기


















가격
가입일 23/06/2025
1
판매