Açıklama
HTF Önyargı Dedektörü — Panel Sürümü
Daha yüksek zaman dilimi hikayesini bir bakışta görün. HTF Önyargı Dedektörü, son N yüksek zaman dilimi mumlarını doğrudan grafiğinizde yüzen bir panelde gösterir — zaman dilimleri arasında geçiş yapmanıza gerek yok — ve dört kurumsal fiyat hareketi deseni kullanarak baskın önyargıyı otomatik olarak tanımlar.
Nasıl Çalışır
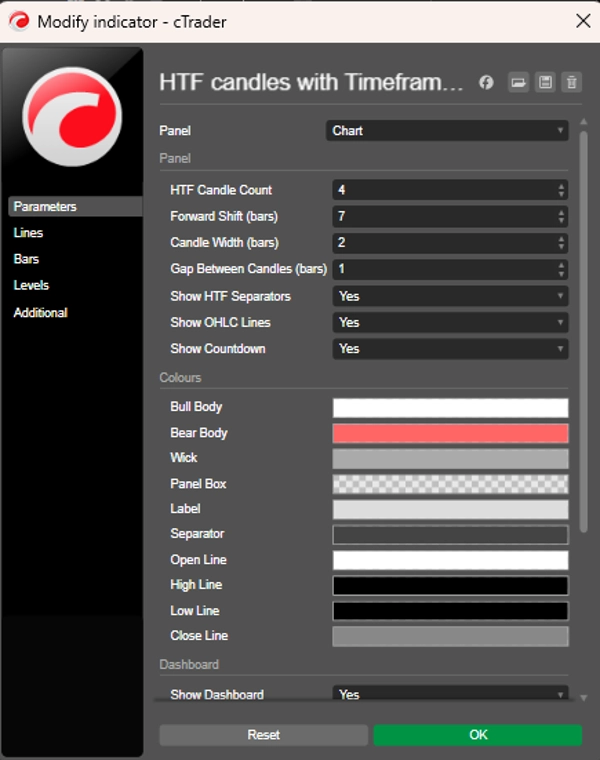
Gösterge, mevcut grafik zaman diliminizi doğal daha yüksek zaman dilimine eşler (örneğin 5D → 1S, 1S → Günlük) ve bu HTF mumlarını fiyatın sağ tarafına sabitlenmiş temiz bir panelde çizer. Desen tespiti daha sonra bu mumlar üzerinde gerçek zamanlı olarak çalışır.
Tespit Edilen Desenler
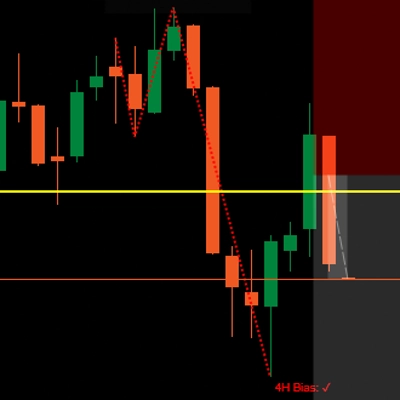
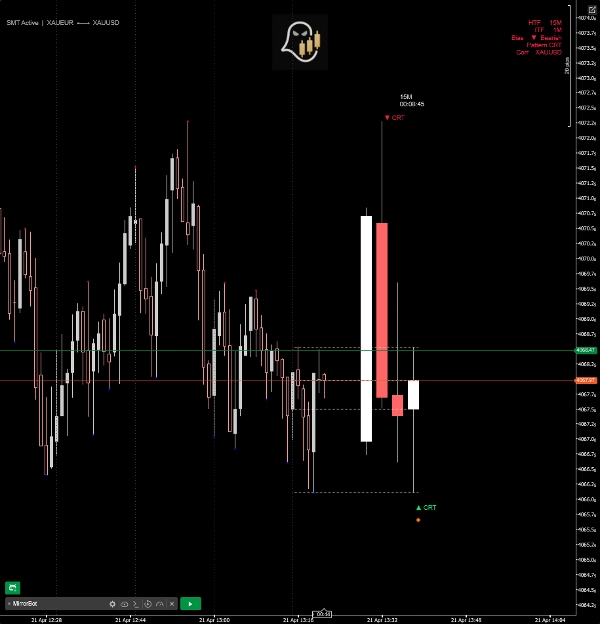
- CRT (Mum Aralığı Teorisi) — önceki bir yüksek veya düşük seviyeyi süpüren ve tekrar içine kapanan tuzak mumlarını tanımlar, olası bir dönüş sinyali verir.
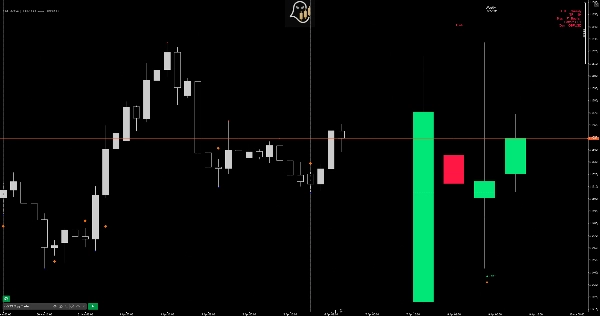
- Genişleme — önceki aralığı tamamen kapsayan ve ötesinde kapanan mumları işaretler, yönlü momentumu doğrular.
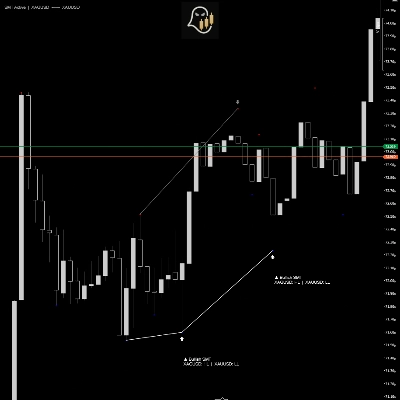
- Salınım Noktası — yer değiştirme mumunu güçlü bir dönüşün takip ettiği üç mumluk dizileri tespit eder, yapısal bir dönüm noktasını işaretler.
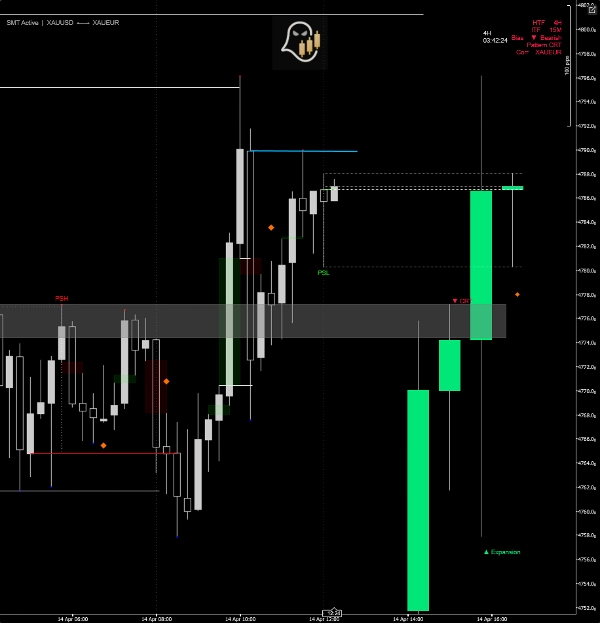
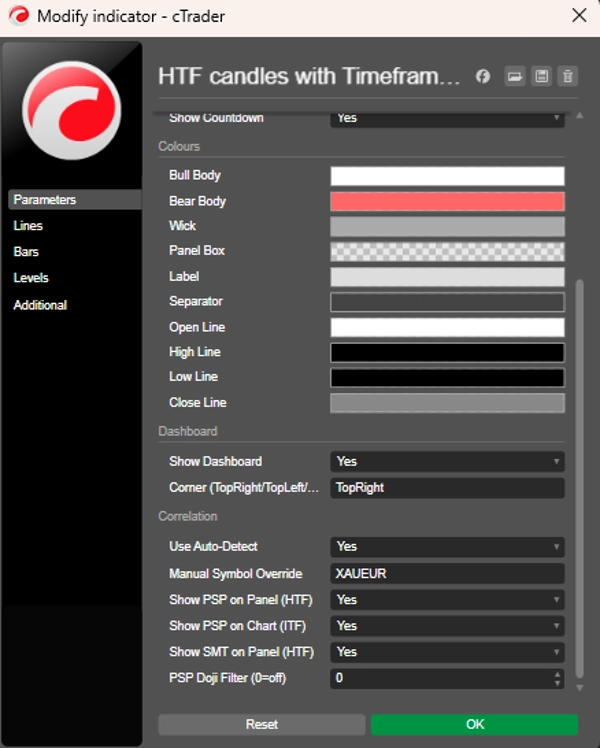
- PSP (Hassas Salınım Noktası) — çapraz çift uyumsuzluğu sinyali. Ana sembol ve ilişkili çifti aynı HTF barında zıt yönlü mumlar oluşturduğunda, bir PSP elması çizilir.
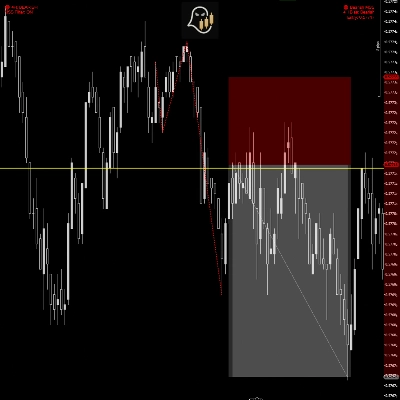
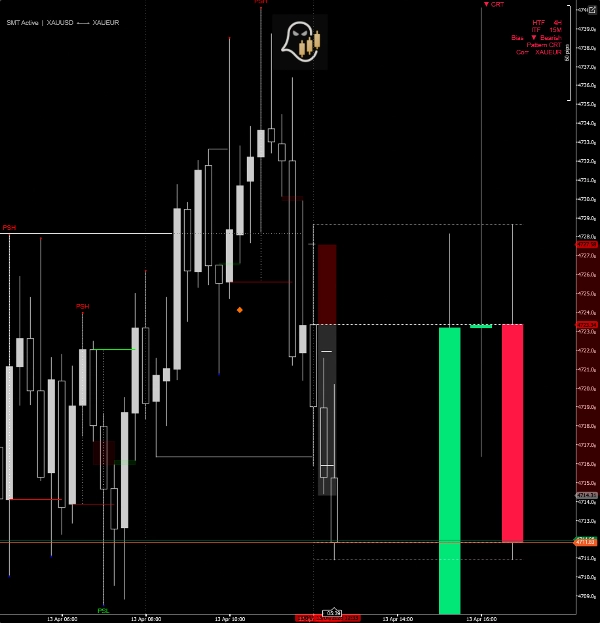
SMT Uyumsuzluğu (HTF Paneli)
İlişkili enstrümanlar arasındaki ardışık HTF mum çiftlerini karşılaştırır. Bir çift daha düşük dip yaparken diğer çift daha yüksek dip yaparsa (veya yükseklerde tam tersi), panel üzerinde yönlü bir etiketle SMT uyumsuzluk çizgisi çizilir.
İlişkili Çift Otomatik Tespiti
Grafik sembolünüz için ilişkili enstrümanı otomatik olarak çözer — büyük forex çiftleri, metaller, endeksler ve kriptoyu kapsar. Özel eşleştirmeler veya broker’a özgü sembol isimleri için manuel geçersiz kılma da mevcuttur.
Ek Özellikler
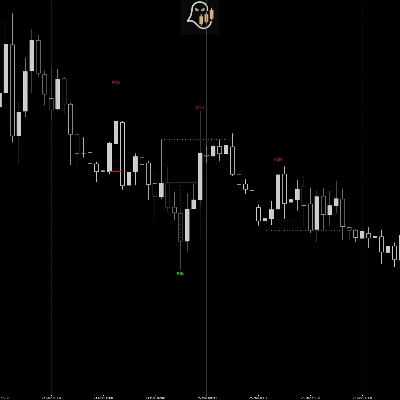
- Bir sonraki HTF mum kapanışına canlı geri sayım sayacı
- Şu anda oluşan HTF mum için OHLC noktalı referans çizgileri
- HTF açılış zamanlarına hizalanmış canlı grafikte dikey ayırıcılar
- HTF, ITF, tespit edilen önyargı, desen adı ve ilişkili çifti gösteren kompakt kontrol paneli
- Grafik çubukları üzerinde doğrudan çizilen ITF PSP elmasları (mevcut zaman dilimi)
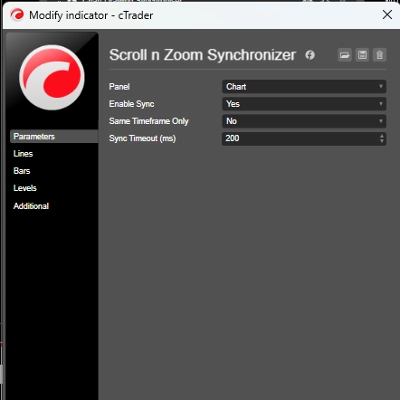
- Tamamen özelleştirilebilir renkler, panel genişliği, mum sayısı ve konumlandırma
- Zayıf PSP sinyallerini bastırmak için Doji filtresi
Zaman Dilimi Haritası
Grafik ZD HTF Panel
1D – 4D 15D
5D – 10D 1S
15D – 30D 4S
1S Günlük
4S Haftalık
Günlük Aylık
Özet
Müşteri değerlendirmeleri
5 | 50 % | |
4 | 50 % | |
3 | 0 % | |
2 | 0 % | |
1 | 0 % |