
Açıklama
Balina Avı Göstergesi – Bukhari Akademisi
Balina Avı Göstergesi, özellikle Boom & Crash endeksleri ve Volatilite endeksleri için tasarlanmış güçlü bir ticaret aracıdır. Otomatik Trend Algılayıcı içerir, boğa ve ayı trendlerini tespit eder, piyasa yapı noktalarını (HH, HL, LH, LL) işaretler ve tüccarların bilinçli kararlar vermesine yardımcı olmak için yüksek hassasiyetli alım ve satım sinyalleri sağlar.
Ana Özellikler:
✅ Otomatik Trend Algılayıcı – Piyasa trendlerini otomatik olarak tanır, manuel analiz ihtiyacını azaltır.
✅ Boom & Crash ve Volatilite Endeksleri için Tasarlandı – Bu sentetik piyasalar için optimize edilmiştir.
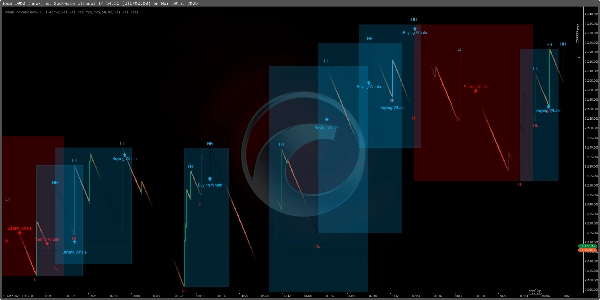
✅ Boom & Crash (M1 Zaman Dilimi) Üzerinde Spike Tespiti – M1 üzerindeki potansiyel spike'ları tespit eder, tüccarların hızlı fiyat hareketlerini yakalamasına yardımcı olur.
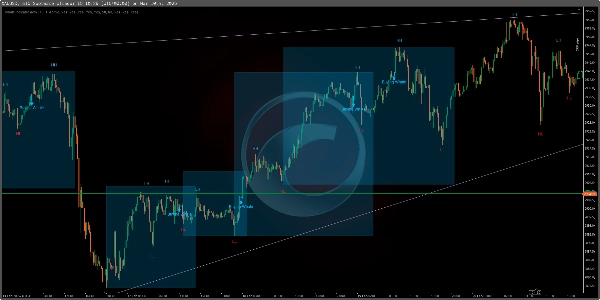
✅ M15 Üzerinde Trend Tanımlama – Normal trend analizi ve yapılandırılmış ticaret düzenleri için M15 üzerinde etkili çalışır.
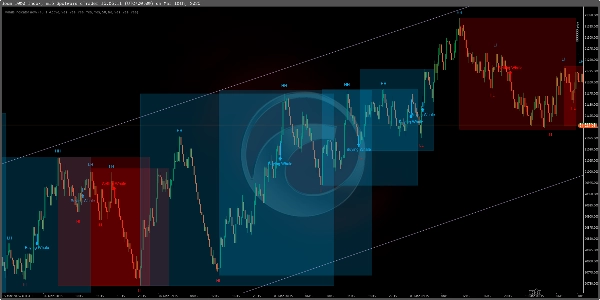
✅ Piyasa Yapısı Analizi – Daha iyi trend anlayışı için Yüksek Yüksekler (HH), Yüksek Düşükler (HL), Düşük Yüksekler (LH) ve Düşük Düşükler (LL) gösterir.
✅ Balina Giriş Sinyalleri – Doğru ticaret girişleri için "Alım Balinası" ve "Satım Balinası" noktalarını vurgular.
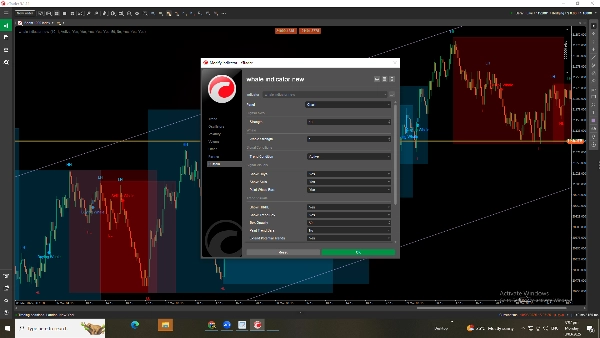
✅ Tamamen Özelleştirilebilir Ayarlar – Ticaret yaklaşımınızı geliştirmek için balina gücü, sinyal hassasiyeti ve trend koşullarını ayarlayın.
✅ Özellikleri Etkinleştir/Kapat – İhtiyaç duyduğunuzda trend kutuları, yapı noktaları ve alım/satım sinyallerini açıp kapatın.
Balina Avı Göstergesi Nasıl Kullanılır?
1️⃣ Otomatik Trend Algılama – Göstergenin trend yönünü otomatik olarak tanımlamasına izin verin.
2️⃣ M1 Üzerinde Boom & Crash Spike'larını Ticareti – Fiyat spike'larını etkili şekilde yakalamak için M1 üzerindeki sinyalleri arayın.
3️⃣ M15 Üzerinde Piyasa Trendlerini Analiz Edin – Yapılandırılmış trend analizi ve ticaret onayı için M15'i kullanın.
4️⃣ Piyasa Yapısını Takip Edin – Trend yönünü ve gücünü anlamak için HH, HL, LH, LL kullanın.
5️⃣ Balina Sinyallerini Arayın – Ticaretlere "Alım Balinası" veya "Satım Balinası" noktalarında girin.
6️⃣ Doğruluk İçin Özelleştirin – Sonuçları optimize etmek için balina gücü ve sinyal hassasiyetini ayarlayın.
7️⃣ Özellikleri Etkinleştir/Kapat – Stratejinize göre trend koşullarını ve yapı ayarlarını değiştirin.
Bu gösterge, Boom & Crash ve Volatilite endeksleri için mükemmeldir ve yüksek olasılıklı ticaret fırsatlarını hassasiyet ve verimlilikle sunar. 🚀
Özet
Key functionalities include spike detection on the M1 timeframe for Boom & Crash indices to capture rapid price movements, and trend identification on the M15 timeframe for structured trade setups. Users can customize settings such as whale strength, signal sensitivity, and trend conditions to refine their trading approach. Features like trend boxes, structure points, and buy/sell signals can be enabled or disabled according to user preference.
The indicator supports efficient analysis and trade execution in synthetic markets, offering tools for both short-term spike trading and longer-term trend analysis. It is suitable for traders focusing on Boom & Crash and Volatility indices who seek precise market insights and customizable signal options.
Müşteri değerlendirmeleri
5 | 33 % | |
4 | 67 % | |
3 | 0 % | |
2 | 0 % | |
1 | 0 % |


