
Mô tả
═══════════════════════════════════════════════════════════════
EMA MTF TREND PRO — Chỉ báo Phân tích Xu hướng Đa Khung thời gian
Chỉ báo phủ cTrader
═══════════════════════════════════════════════════════════════
Xem toàn bộ bức tranh xu hướng trên 6 khung thời gian — trong một bảng,
trên một biểu đồ, mà không cần chuyển đổi cửa sổ.
───────────────────────────────────────────────────────────────
NHỮNG GÌ NÓ LÀM
───────────────────────────────────────────────────────────────
EMA MTF Trend Pro kết hợp hướng xu hướng EMA, cấu trúc kênh Wilder,
mức Kijun-sen, sức mạnh ADX, tín hiệu giao cắt,
và sự kiệt sức động lượng thành một bảng điều khiển trực tiếp duy nhất.
Mỗi hàng trong bảng là một khung thời gian khác nhau. Mỗi cột
trả lời một câu hỏi khác về khung thời gian đó. Chỉ cần nhìn qua
bạn sẽ biết liệu các khung thời gian có đồng thuận — và liệu có an toàn để
vào lệnh.
───────────────────────────────────────────────────────────────
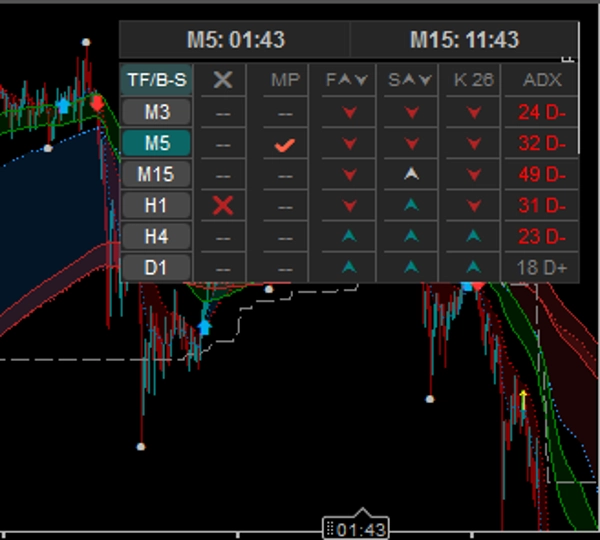
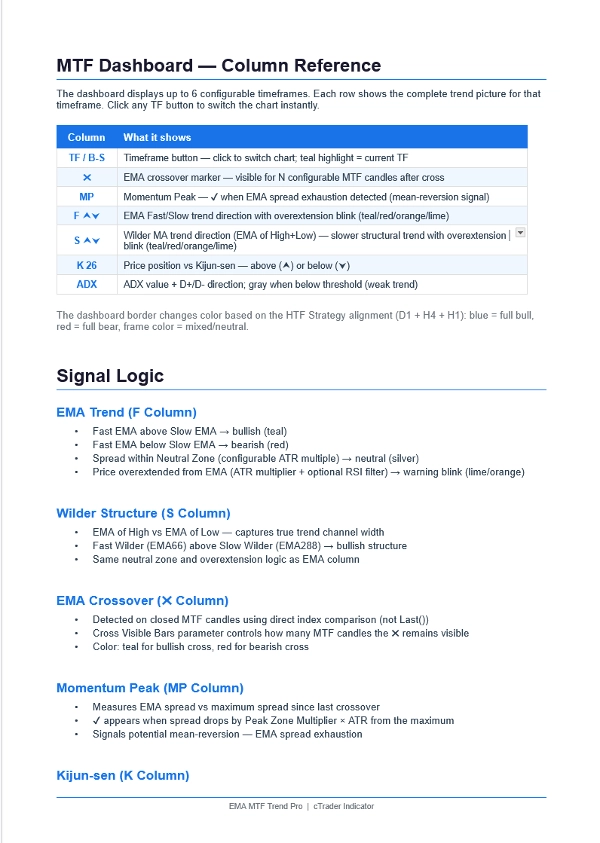
BẢNG ĐIỀU KHIỂN — 6 KHUNG THỜI GIAN × 7 CỘT
───────────────────────────────────────────────────────────────
Cột Hiển thị nội dung gì
──────── ──────────────────────────────────────────────────
Nút TF/B-S Khung thời gian — nhấp để chuyển biểu đồ ngay lập tức
Nổi bật màu xanh lam = khung thời gian đang hiển thị
✖ Giao cắt EMA — hiển thị cho N cây nến có thể cấu hình
Xanh lam = giao cắt tăng | Đỏ = giao cắt giảm
MP Đỉnh Động lượng — ✔ khi khoảng cách EMA đã kiệt sức
Tín hiệu cảnh báo hồi quy trung bình
F ⮝⮟ Hướng xu hướng EMA Nhanh so với Chậm
Xanh lam = lên | Đỏ = xuống | Bạc = trung lập
Nhấp nháy khi giá vượt quá mức EMA
S ⮝⮟ Cấu trúc MA Wilder (EMA của Cao/Thấp)
Bộ lọc xu hướng chậm hơn, mang tính cấu trúc hơn
K 26 Giá so với Kijun-sen
⮝ = giá trên (hỗ trợ) | ⮟ = dưới (kháng cự)
ADX Sức mạnh xu hướng + hướng D+/D-
Xám = thị trường yếu/đi ngang (dưới ngưỡng)
───────────────────────────────────────────────────────────────
TÍNH NĂNG
───────────────────────────────────────────────────────────────
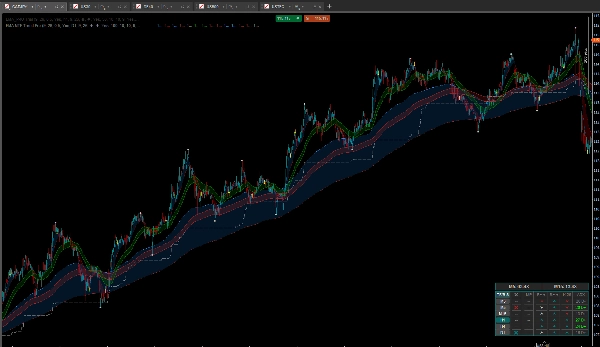
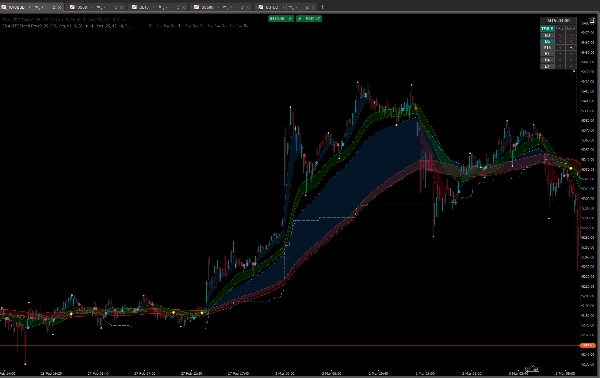
HỆ THỐNG ĐÁM MÂY EMA
• EMA Nhanh + Chậm với đám mây màu sắc
• Phát hiện vùng trung lập (bội số ATR có thể cấu hình)
• Cảnh báo vượt quá mức với bộ lọc RSI
PHỦ EMA ĐA KHUNG THỜI GIAN
• Chiếu bất kỳ EMA khung thời gian cao hơn nào lên biểu đồ hiện tại
• Nội suy tuyến tính — đường mượt, không bước nhảy
• Mũi tên giao cắt với biểu tượng và màu sắc có thể cấu hình
• Tự động ẩn mũi tên phủ khi chọn khung thời gian cao hơn
trong bảng điều khiển (ngăn ngừa rối mắt)
ĐỈNH VÀ ĐÁY XOAY CHUYỂN
• Chấm SH / SL xen kẽ — không có đỉnh liên tiếp trùng lặp
• Nhãn văn bản SH / SL tùy chọn với vị trí dựa trên ATR
• Kích thước chấm, kích thước nhãn, màu sắc có thể cấu hình
• Công tắc bật/tắt duy nhất cho toàn bộ hiển thị swing
KIJUN-SEN
• Định nghĩa Hosoda tiêu chuẩn (khớp với TradingView / MT4)
• Chu kỳ có thể cấu hình
• Cũng có sẵn dưới dạng đường phủ MTF trên biểu đồ
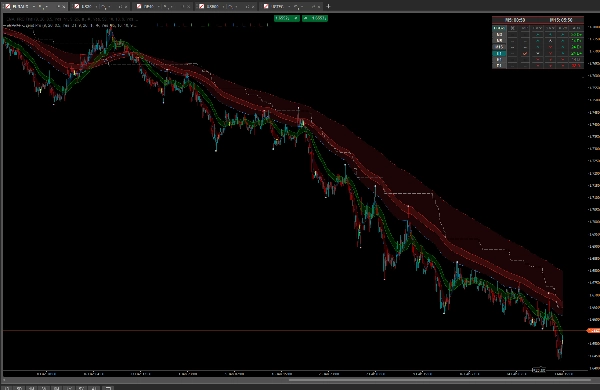
DẢI MA-WILDER
• EMA của Cao và EMA của Thấp — tạo kênh xu hướng
• Dải nhanh (EMA66) + dải chậm (EMA288)
• Có sẵn trên biểu đồ và dưới dạng phủ MTF
BIÊN GIỚI CHIẾN LƯỢC HTF
• Viền bảng điều khiển chuyển sang màu xanh lam khi D1 + H4 + H1
đều tăng (EMA + Wilder đồng thuận)
• Chuyển sang đỏ khi cả ba đều giảm
• Xác nhận trực quan ngay lập tức về sự đồng thuận đa khung thời gian đầy đủ
ĐỒNG HỒ ĐẾM NGƯỢC NẾN
• Đồng hồ kép — bất kỳ hai khung thời gian nào
• Đồng hồ thứ hai có thể theo dõi khung thời gian biểu đồ hiện tại
• Bố cục gọn gàng ở chế độ một cột
CHẾ ĐỘ GỌN / ĐẦY ĐỦ
• Nhấp vào tiêu đề TF/B-S để chuyển đổi
• Chế độ đầy đủ: 7 cột (tất cả tín hiệu)
• Chế độ gọn: 3 cột (TF, EMA, Wilder) — tiết kiệm không gian
───────────────────────────────────────────────────────────────
CHIẾN LƯỢC — CÁCH SỬ DỤNG
───────────────────────────────────────────────────────────────
BƯỚC 1 — XÁC ĐỊNH XU HƯỚNG (Khung thời gian cao hơn)
• Hàng D1: F ⮝ + S ⮝ = cấu trúc ngày tăng
• Hàng H4: cùng hướng = xu hướng được xác nhận
• Viền bảng điều khiển chuyển sang xanh lam = D1 + H4 + H1 đồng thuận
BƯỚC 2 — TÌM ĐIỂM VÀO LỆNH (Khung thời gian thấp hơn)
• Nhấp H1 hoặc M15 trong bảng để chuyển biểu đồ
• Chờ ✖ giao cắt cùng hướng với xu hướng HTF
• Cột K hiển thị ⮝ (giá trên Kijun) cho lệnh mua
• Cột ADX hoạt động, không xám (xu hướng có sức mạnh)
BƯỚC 3 — LỌC BẰNG ĐỈNH ĐỘNG LƯỢNG
• Cột MP hiển thị ✔ → khoảng cách EMA đã kiệt sức → tránh vào lệnh
• Chờ MP biến mất (--) trước khi vào lệnh
• Dùng trên các khung thời gian thấp hơn để tránh vào lệnh ở vùng cực EMA
BƯỚC 4 — SỬ DỤNG CÁC MỨC XOAY CHUYỂN
• Chấm SH = đỉnh swing gần nhất (kháng cự / tham chiếu dừng)
• Chấm SL = đáy swing gần nhất (hỗ trợ / tham chiếu mục tiêu)
• Các chấm xen kẽ — luôn có một đỉnh, một đáy cùng lúc
───────────────────────────────────────────────────────────────
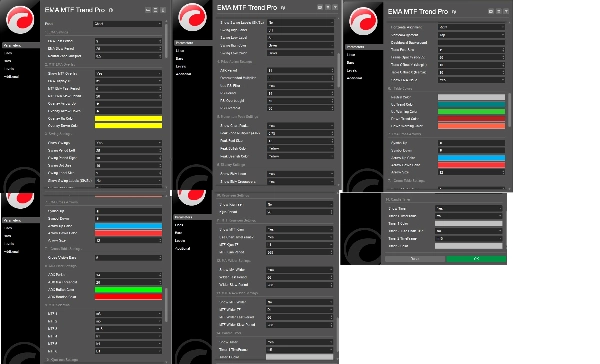
NHÓM THAM SỐ
───────────────────────────────────────────────────────────────
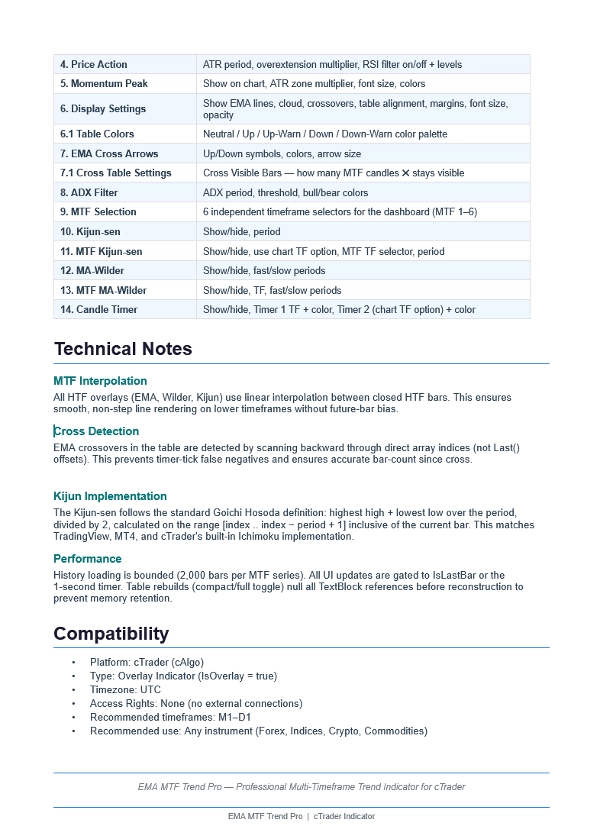
1. Cài đặt EMA — Chu kỳ Nhanh/Chậm, vùng trung lập
2. Phủ EMA MTF — TF, chu kỳ, kiểu mũi tên
3. Cài đặt Swing — Hiện/ẩn, chu kỳ, nhãn, màu sắc
4. Hành động Giá — ATR, vượt quá mức, bộ lọc RSI
5. Đỉnh Động lượng — Bội số vùng, font chữ, màu sắc
6. Cài đặt hiển thị — Đường, đám mây, bố cục bảng
6.1 Màu bảng — Kiểm soát toàn bộ bảng màu
7. Mũi tên giao cắt EMA — Biểu tượng, màu sắc, kích thước
7.1 Cài đặt bảng giao cắt — Thanh giao cắt hiển thị (N cây nến)
8. Bộ lọc ADX — Chu kỳ, ngưỡng, màu sắc
9. Lựa chọn MTF — 6 bộ chọn TF độc lập
10. Kijun-sen — Hiện/ẩn, chu kỳ
11. Kijun-sen MTF — TF, chu kỳ, tùy chọn TF biểu đồ
12. MA-Wilder — Hiện/ẩn, chu kỳ nhanh/chậm
13. MA-Wilder MTF — TF, chu kỳ nhanh/chậm
14. Đồng hồ nến — TF, màu sắc, tùy chọn TF biểu đồ
───────────────────────────────────────────────────────────────
Tóm tắt
Đánh giá của khách hàng
5 | 0 % | |
4 | 100 % | |
3 | 0 % | |
2 | 0 % | |
1 | 0 % |


