
Açıklama
HCCC MTF - Hurst Döngüsü Bileşik Kanalı (%100 ÜCRETSİZ)
Genel Bakış
HCCC MTF (Hurst Döngüsü Bileşik Kanalı) gelişmiş, tamamen etkileşimli Çok Zamanlı Çerçeve (MTF) gösterge paneli ve kanal göstergesidir. J.M. Hurst'un döngü teorileri ile ATR volatilitesinin birleşimine dayanarak, bu araç size gerçek piyasa trendini ve mükemmel döngüsel dönüş noktalarını (zirveler ve dipler) aynı anda birden fazla zaman diliminde tanımlamanıza yardımcı olur.
İkincisi yarı otomatik ticaret için ayrılmıştır https://ctrader.com/products/3618?u=cLogic
ÖNEMLİ: Bu gösterge tamamen %100 ÜCRETSİZDİR. Özellikle "Follow The Trend XAU Edition" cBot için nihai görsel yardımcı olarak geliştirilmiştir.
Manuel ticaret için mükemmel şekilde kullanabilirsiniz, ancak gerçek gücü yarı otomatik bir kurulumda kullanıldığında ortaya çıkar: HCCC Gösterge Panelini kullanarak daha yüksek zaman dilimindeki döngüyü ve momentumu okuyorsunuz, ardından Follow The Trend XAU Edition cBot'u etkinleştirerek işlemleri tam olarak o yönde yürütüp yönetiyorsunuz.
Ana Özellikler
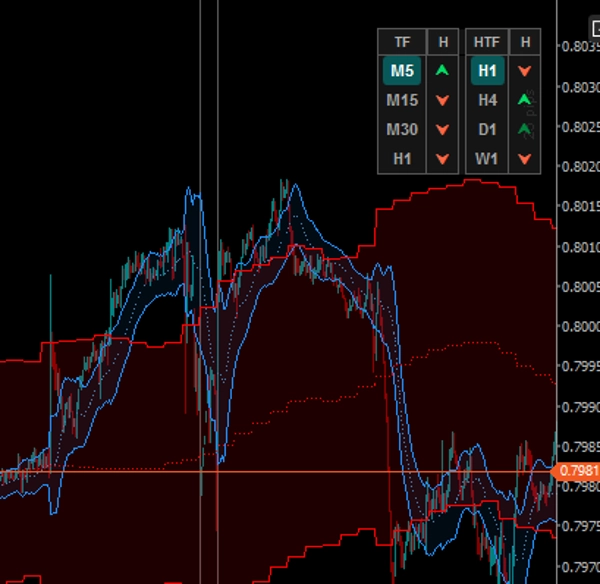
1. Etkileşimli MTF Gösterge Paneli (Tıklanabilir)
Grafikler arasında gidip gelmeyi unutun. Grafik üzerindeki gösterge paneli 4 Daha Düşük Zaman Dilimini (LTF) ve 4 Daha Yüksek Zaman Dilimini (HTF) takip eder.
- LTF Düğmeleri: Herhangi bir LTF düğmesine tıklayarak mevcut grafiğinizin zaman dilimini anında değiştirebilirsiniz.
- HTF Düğmeleri: Herhangi bir HTF düğmesine tıklayarak o belirli Daha Yüksek Zaman Diliminin kanalını doğrudan mevcut grafiğinize yansıtabilirsiniz!
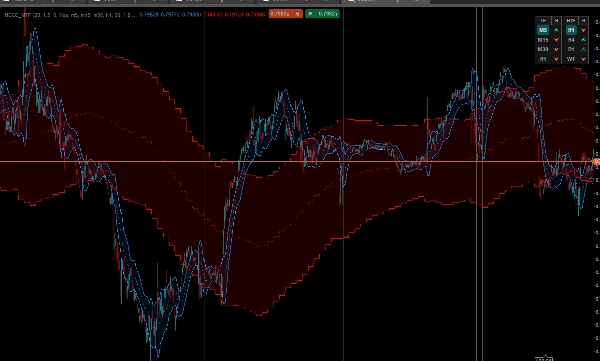
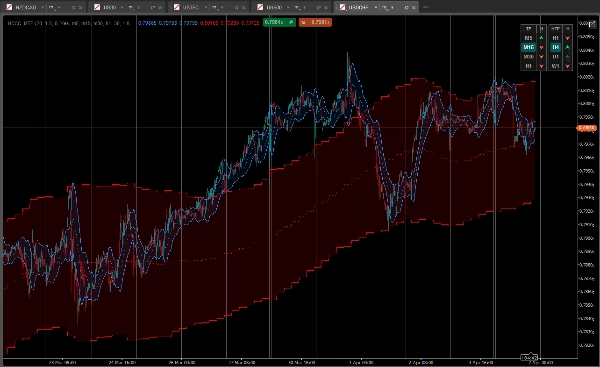
2. Çift Kanal Üst Üste Binen Sistemi
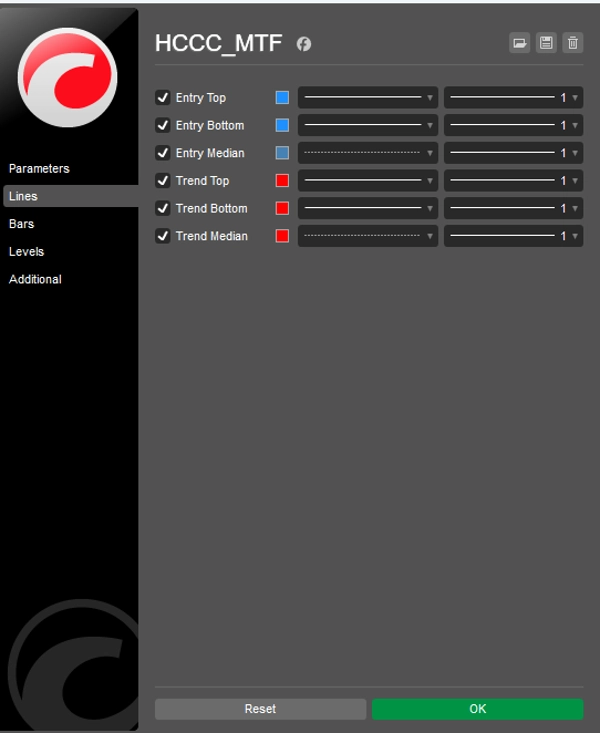
Gösterge, grafiğinizde aynı anda iki şık, bulut dolu kanal çizer:
- Giriş Döngüsü (Mavi Bulut): Mevcut grafik zaman diliminize göre Hurst döngüsünü hesaplar.
- Trend Döngüsü (Kırmızı Bulut): Gösterge panelinde seçtiğiniz Daha Yüksek Zaman Diliminden hesaplanan makro görünüm kanalı.
3. Gelişmiş 5 Durumlu Döngüsel Sinyaller
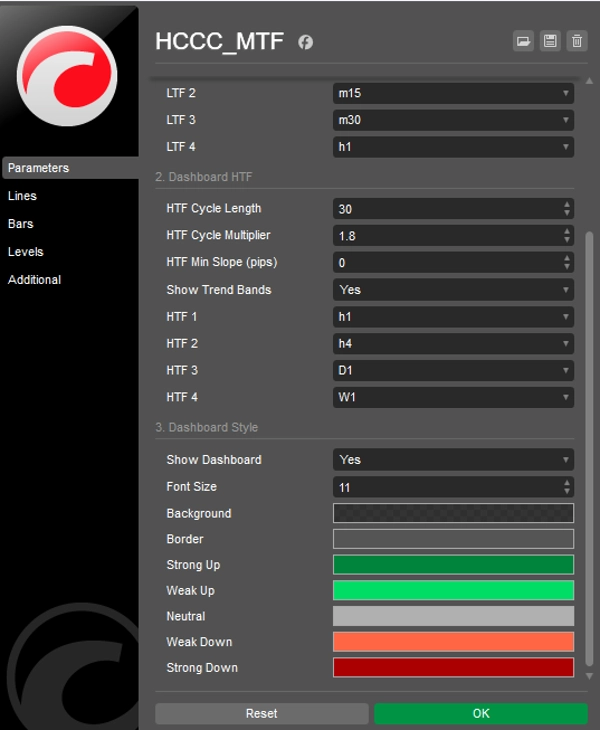
Gösterge paneli sadece trend yönünü göstermez; medyan çizgisinin eğimini ve fiyatın ATR bantlarına göre konumunu analiz ederek döngünün aşamasını gösterir.
- [ ⮝ ] Koyu Yeşil (Güçlü Alış): Medyan eğim YUKARI ve fiyat alt banda düşmüştür. Bu döngüsel dip (düşüşte alım) anlamına gelir.
- [ ⮝ ] Açık Yeşil (Zayıf Alış): Trend YUKARI, ancak fiyat medyan veya üst bant civarındadır.
- [ — ] Gri (Nötr): Döngü düz. Belirgin momentum yok.
- [ ⮟ ] Açık Kırmızı (Zayıf Satış): Trend AŞAĞI, ancak fiyat medyan civarındadır.
- [ ⮟ ] Koyu Kırmızı (Güçlü Satış): Medyan eğim AŞAĞI ve fiyat üst banda yükselmiştir. Bu döngüsel zirve (rallide satış) anlamına gelir.
"Follow The Trend XAU Edition" cBot ile nasıl kullanılır?
- Gösterge panelinin sağ tarafına (HTF Sütunu) bakın. Daha Yüksek Zaman Dilimlerinde (örneğin, H4 ve D1'de Koyu/Açık Yeşil Oklar) net bir hizalanma bekleyin.
- Gösterge panelinin sol tarafına (LTF Sütunu) bakarak yerel bir geri çekilme bulun (örneğin, M15'te Koyu Yeşil "Güçlü Alış" oku gösteriliyor).
- MTF mantığı hizalandığında, Follow The Trend XAU Edition cBot'unuzu "ALIŞ" yönünde etkinleştirin ve algoritmalarının giriş, takip eden durdurmalar ve risk yönetimini yapmasına izin verin.
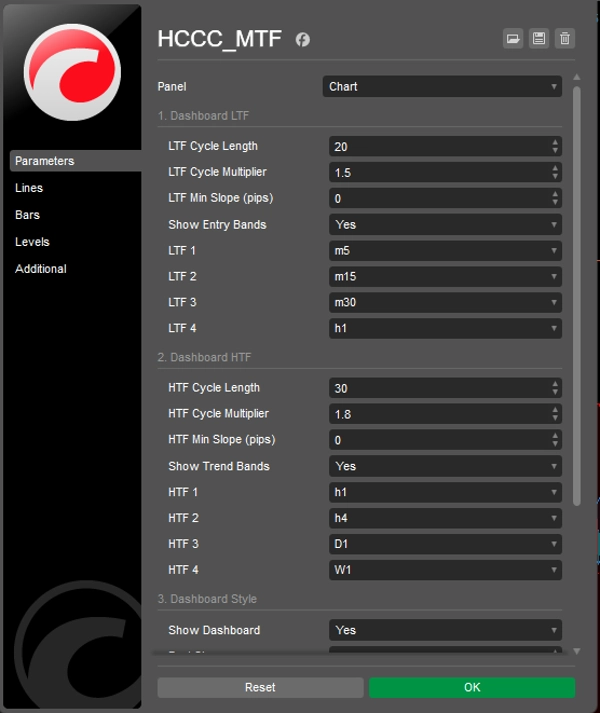
Özelleştirme
Her şey tamamen özelleştirilebilir: Döngü uzunlukları, ATR çarpanları, gürültüyü filtrelemek için minimum eğim hassasiyeti (pip cinsinden) ve kullanıcı arayüzü renkleri ile konumlandırma üzerinde tam kontrol.
Şimdi ÜCRETSİZ olarak indirin ve yarı otomatik ticaretinizi bir üst seviyeye taşıyın!
Özet
It overlays two cloud-filled channels: a blue "Entry Cycle" channel based on the current timeframe and a red "Trend Cycle" channel derived from a selected higher timeframe. The dashboard provides advanced five-state cyclic signals indicating strong or weak buy/sell conditions and neutral phases by analyzing the slope of the median line and price position relative to ATR bands.
The indicator is fully customizable, including cycle lengths, ATR multipliers, slope sensitivity, and UI appearance. It is intended to complement the "Follow The Trend XAU Edition" cBot by providing visual cycle and momentum analysis to guide semi-automated trade execution and management. The HCCC MTF supports various markets including Forex, commodities, indices, stocks, and cryptocurrencies.


