
Consolidation Zones
Indicatore
1 acquisti
Versione 1.0, Oct 2025
Windows, Mac
4.0
Recensioni: 1
Descrizione
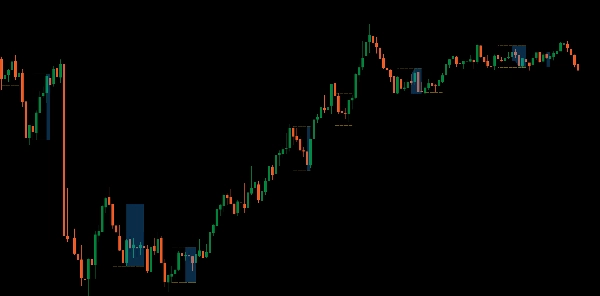
Presentiamo l'indicatore Consolidation Zones, progettato per aiutarti a identificare e sfruttare con facilità le opportunità di breakout.
Questo potente strumento evidenzia le zone sul tuo grafico in cui il prezzo si sta consolidando, rendendo semplice individuare i potenziali punti di breakout. Visualizzando queste aree critiche, puoi anticipare meglio i movimenti di mercato e prendere decisioni di trading più informate.
Ideale per i trader che desiderano migliorare la propria strategia con intuizioni chiare e pratiche, aggiorna la tua cassetta degli attrezzi per il trading e padroneggia i breakout con l'indicatore Consolidation Zones.
Riepilogo
Riepilogo AI
The Consolidation Zones indicator identifies and visualizes price consolidation areas on trading charts to help traders spot potential breakout points. By highlighting these zones, it assists in anticipating market movements and supports more informed decision-making. This tool is applicable across multiple markets, including Forex, cryptocurrencies (e.g., BTCUSD), commodities (e.g., gold, oil), indices (e.g., NAS100, SP500), and stocks. It is designed to enhance trading strategies focused on breakout opportunities by providing clear visual cues of consolidation phases.
Profilo indicatore
Recensioni dei clienti
4.0
Recensioni: 1
5 | 0 % | |
4 | 100 % | |
3 | 0 % | |
2 | 0 % | |
1 | 0 % |
Recensioni dei clienti
October 12, 2025
Two timeframes give more context, and the log becomes easier to read.
Discussioni
Domande frequenti
BTCUSD
Forex
Breakout
Indices
EURUSD
Commodities
GBPUSD
NZDUSD
Prop
Crypto
Stocks
XAUUSD
NAS100
USDJPY
I prodotti disponibili tramite cTrader Store, inclusi bot di trading, indicatori e plugin, sono forniti da sviluppatori terzi e resi disponibili esclusivamente a scopo informativo e di accesso tecnico. cTrader Store non è un broker e non fornisce consulenze in materia di investimento, raccomandazioni individualizzate o garanzie di risultati futuri.


Prezzo
Da 25/09/2025
25
Vendite
315
Installazioni gratuite