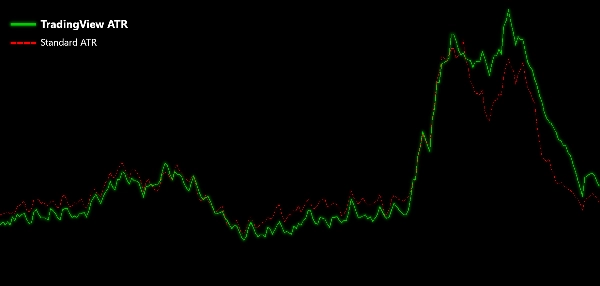
Logo "TradingView ATR"
TradingView ATR
Imej yang dimuat naik "TradingView ATR"
Sejak 25/09/2025
21
Jualan
179
Pemasangan percuma

Introducing the TradingView ATR indicator for cTrader, designed to match the precision of TradingView’s Average True Range calculation.

This enhanced ATR uses a Relative Moving Average (RMA) for its calculations, providing a more accurate reflection of market volatility compared to the default ATR in cTrader. By incorporating the RMA, this indicator offers smoother and more responsive volatility readings, helping you make better-informed trading decisions.

Perfect for traders seeking improved accuracy in their technical analysis, this ATR indicator is a powerful tool to elevate your trading strategy.

Upgrade your cTrader toolkit with this ATR indicator for precise and reliable volatility insights.

Indicator profile
0.0
Ulasan: 0
Ulasan pelanggan
Belum ada ulasan untuk produk ini. Anda sudah mencuba produk tersebut? Jadilah yang pertama untuk berkongsi pendapat anda!
BTCUSD
Forex
Indices
EURUSD
Commodities
GBPUSD
NZDUSD
Prop
ATR
Crypto
Stocks
XAUUSD
NAS100
USDJPY
Products available through cTrader Store, including trading bots, indicators and plugins, are provided by third-party developers and made available for informational and technical access purposes only. cTrader Store is not a broker and does not provide investment advice, personal recommendations or any guarantee of future performance.

Lebih banyak produk daripada penulis ini

Professional execution engine for the Visual Risk Terminal. Instant batch orders, PnL syncing, and automated hedging.
1
Faktor keuntungan
0%
Susutan maksimum
Optimize exits with Chandelier Exit! Visualize stop-loss points dynamically for improved trading precision and safety.
Enhance trading with ATR Bands! Visualize market volatility using dynamic upper and lower ATR bands for precise decision
Enhance MACD Histogram! Visualize bull and bear price changes with vibrant colors for clearer, more insightful trading.
Unlock trading precision with QQE! Dual QQE indicators with a Bollinger Bands zero line provide clear buy/sell signals.
Customize the MACD! Choose colors, get real-time tick updates, and see crossover points for enhanced trading precision.
Identify and trade breakouts with Consolidation Zones! Visualize price consolidation areas for trading opportunities.
Visual risk management terminal for cTrader. Set Lot size, SL, and TP via chart lines with real-time PnL projections.
Customize your Moving Average! Choose any timeframe and price source for precision and flexibility in your analysis.
Visualize trends with Standard Deviation Channel! Display median, and add customizable upper/lower deviation channels.
Unlock Stochastic RSI PRO in cTrader! Overlay RSI, highlight zones, and identify divergences with customizable settings.
Advanced MACD & Supertrend bot. Professional trend-following logic with ATR risk management and active profit-taking.
18%
1.82
Faktor keuntungan
20.05%
Susutan maksimum

Anda juga mungkin suka

😎Read the description before purchasing💩
A lightweight cTrader indicator that overlays ATR-based SL and TP levels in pips directly on your chart
The KDJ oscillator display consists of 3 lines (K, D and J - hence the name of the display) and 2 levels.
VWAP Tabajara
Cursor Price Info - A real-time information panel that displays key metrics when you hover over the chart
A professional trading utility that displays real-time daily range statistics directly on your chart
Taiz Pro Volume Profile مؤشر احترافي لتحليل الحجم (Volume Profile) يكشف عن مناطق الدعم والمقاومة الحقيقية التي يركز عليه
Draws support and resistance on all pairs.
POSITION SIZE CALCULATOR
Multi-timeframe S/R, SRWMA trend & Demarker pivots with smart alerts—clarity for any market, any timeframe.
Analyzes candles (adjustable period): dominance, difference, and volatility in pips for market reading.
Enhance trading with TSI! Use the True Strength Index for clear insights into market momentum and trend strength.
Buy-Side & Sell-Side Liquidity (BSL/SSL) Indicator
Logo "Follow Line"
4.5
(4)
Percuma
The Follow Line Indicator is a versatile tool designed to identify market trends and provide accurate buy/sell signals.
Logo "Vwap PRO"
5.0
(2)
Percuma
VWAP Pro – The Ultimate VWAP 💎💰
The Linear Regression Oscillator (LRO) is a technical indicator based on linear regression analysis.
Identifies market imbalances and visually marks key areas based on price patterns and volatility (ATR).
GUPPY TREND MASTER V3.. Visualize Market Sentiment with the 38-EMA Rainbow The Guppy Trend Master 4X4 Indicator
Sejak 25/09/2025
21
Jualan
179
Pemasangan percuma