
Descrizione
Presentazione del migliorato MACD Histogram, progettato per offrire un'esperienza di trading più chiara e approfondita.
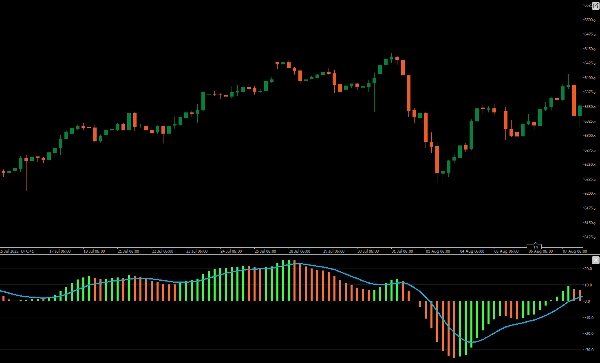
Questo indicatore aggiornato mostra un istogramma colorato e vivace che distingue tra variazioni di prezzo rialziste e ribassiste, andando oltre il formato a colore singolo predefinito. Utilizzando colori distinti per i movimenti positivi e negativi, offre un'indicazione visiva immediata delle condizioni di mercato, facilitando l'interpretazione dei cambiamenti di momentum e delle potenziali inversioni di tendenza.
Perfetto per i trader che cercano maggiore chiarezza e precisione, questo MACD Histogram aggiornamento trasforma il tuo grafico in uno strumento analitico più potente. Eleva la tua strategia di trading con il migliorato MACD Histogram.
Riepilogo
Recensioni dei clienti
5 | 50 % | |
4 | 50 % | |
3 | 0 % | |
2 | 0 % | |
1 | 0 % |


