
Penerangan
Memperkenalkan penunjuk QQE (Qualitative Quantitative Estimation) lanjutan, alat yang kuat yang menggabungkan dua penunjuk QQE untuk wawasan perdagangan yang dipertingkatkan.
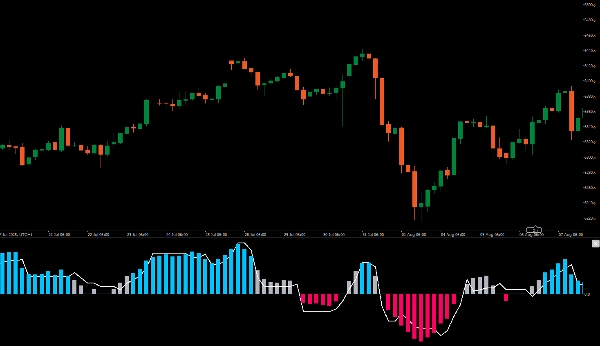
Satu QQE dipaparkan pada carta sebagai lajur, manakala satu lagi beroperasi di latar belakang dengan Bollinger Band 50 tempoh yang bertindak sebagai garis sifar.
Susunan ini membolehkan anda mengukur momentum pasaran secara visual dan mengenal pasti titik kemasukan yang berpotensi dengan jelas. Apabila kedua-dua penunjuk QQE sejajar, anda akan melihat bar biru atau merah yang jelas, menandakan peluang beli atau jual yang kuat.
Tingkatkan strategi perdagangan anda dengan penunjuk QQE untuk keputusan yang lebih bermaklumat dan ketepatan yang dipertingkatkan dalam analisis pasaran anda.Memperkenalkan penunjuk QQE (Qualitative Quantitative Estimation) lanjutan, alat yang kuat yang menggabungkan dua penunjuk QQE untuk wawasan perdagangan yang dipertingkatkan.
Satu QQE dipaparkan pada carta sebagai lajur, manakala satu lagi beroperasi di latar belakang dengan Bollinger Band 50 tempoh yang bertindak sebagai garis sifar.
Susunan ini membolehkan anda mengukur momentum pasaran secara visual dan mengenal pasti titik kemasukan yang berpotensi dengan jelas. Apabila kedua-dua penunjuk QQE sejajar, anda akan melihat bar biru atau merah yang jelas, menandakan peluang beli atau jual yang kuat.
Tingkatkan strategi perdagangan anda dengan penunjuk QQE untuk keputusan yang lebih bermaklumat dan ketepatan yang dipertingkatkan dalam analisis pasaran anda.
Ringkasan
Ulasan pelanggan
5 | 100 % | |
4 | 0 % | |
3 | 0 % | |
2 | 0 % | |
1 | 0 % |


