
MACD Crossover PRO
Indikator
3 pembelian
Versi 1.0, Oct 2025
Windows, Mac
5.0
Ulasan: 1
Penerangan
Memperkenalkan penunjuk MACD klasik yang boleh disesuaikan, direka untuk meningkatkan pengalaman dagangan anda dengan ciri-ciri yang diperibadikan.
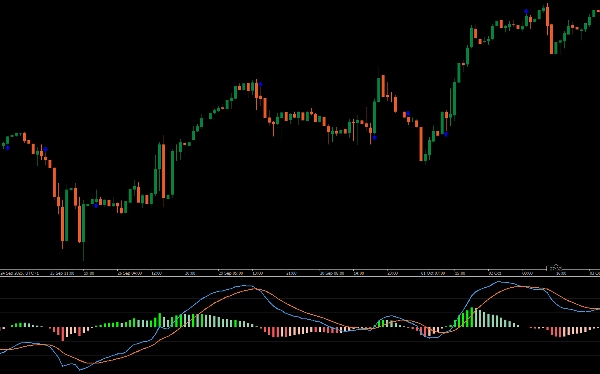
Versi yang dipertingkatkan ini bagi MACD tradisional membolehkan anda menyesuaikan warna garis dan histogram untuk visualisasi carta yang lebih jelas. Secara pilihan, ia boleh dikemas kini secara masa nyata menggunakan data tick dan bukannya penutupan lilin, memberikan pandangan tepat pada masanya dalam pasaran yang pantas.
Selain itu, ia menyerlahkan titik persilangan terus pada carta, memudahkan untuk mengenal pasti isyarat beli dan jual yang berpotensi.
Tingkatkan strategi dagangan anda dengan penunjuk MACD klasik yang boleh disesuaikan untuk ketepatan dan pembuatan keputusan yang lebih baik.
Ringkasan
Ringkasan AI
MACD Crossover PRO is a customizable version of the classic MACD (Moving Average Convergence Divergence) indicator designed for enhanced trading analysis. It allows users to personalize the colors of the MACD lines and histogram for improved chart clarity. The indicator supports real-time updates based on tick data rather than waiting for candle closes, providing more immediate insights in fast-moving markets. It also visually highlights crossover points on the chart, aiding in the identification of potential buy and sell signals. This tool is applicable across various markets including Forex, cryptocurrencies, stocks, commodities, and indices, supporting symbols such as BTCUSD, EURUSD, GBPUSD, XAUUSD, NAS100, and USDJPY. The indicator is suited for traders employing strategies like scalping and signal-based entries, aiming to improve precision and decision-making through enhanced visualization and timely data updates.
Profil indikator
Ulasan pelanggan
5.0
Ulasan: 1
5 | 100 % | |
4 | 0 % | |
3 | 0 % | |
2 | 0 % | |
1 | 0 % |
Ulasan pelanggan
October 15, 2025
The first test should keep DD under 3 percent. The review process gets less scattered.
Perbincangan
Soalan Lazim
BTCUSD
Forex
Signal
Indices
EURUSD
Commodities
GBPUSD
NZDUSD
Prop
Scalping
Crypto
Stocks
XAUUSD
NAS100
MACD
USDJPY
Produk yang tersedia melalui cTrader Store, termasuk bot dagangan, indikator dan plugin, disediakan oleh pembangun pihak ketiga dan diberikan akses untuk tujuan maklumat dan teknikal sahaja. cTrader Store bukan broker dan tidak memberikan nasihat pelaburan, syor peribadi atau sebarang jaminan prestasi masa hadapan.


Harga
Sejak 25/09/2025
25
Jualan
315
Pemasangan percuma