
Penerangan
Memperkenalkan Histogram MACD yang dipertingkatkan, direka untuk memberikan pengalaman perdagangan yang lebih jelas dan bermakna.
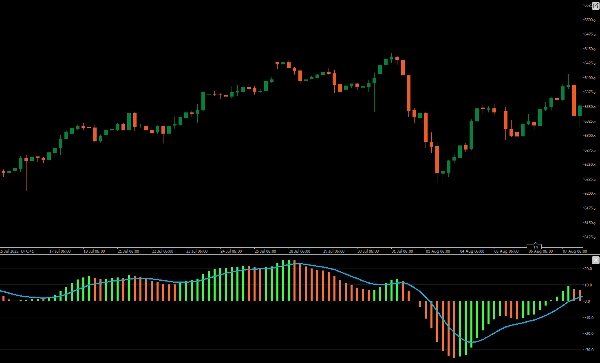
Penunjuk yang dipertingkatkan ini memaparkan histogram berwarna yang terang yang membezakan antara perubahan harga bullish dan bearish, melebihi format warna tunggal lalai. Dengan menggunakan warna yang berbeza untuk pergerakan positif dan negatif, ia menawarkan petunjuk visual segera tentang keadaan pasaran, memudahkan untuk mentafsir perubahan momentum dan kemungkinan pembalikan tren.
Sesuai untuk pedagang yang mencari kejelasan dan ketepatan yang dipertingkatkan, Histogram MACD ini mengubah carta anda menjadi alat analisis yang lebih berkuasa. Tingkatkan strategi perdagangan anda dengan Histogram MACD yang dipertingkatkan.
Ringkasan
Ulasan pelanggan
5 | 50 % | |
4 | 50 % | |
3 | 0 % | |
2 | 0 % | |
1 | 0 % |


