
Fractals
مؤشر
2 عمليات الشراء
الإصدار 1.0، Aug 2025
Windows, Mac
4.0
التقييمات: 2
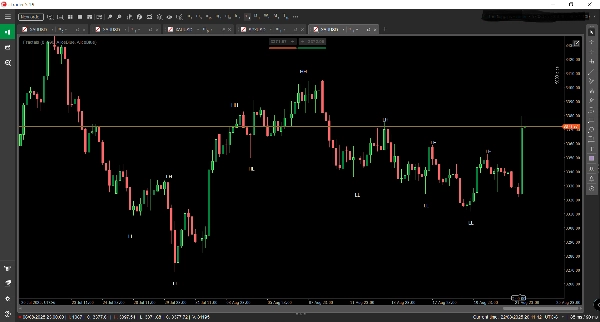
🧠 الفراكتلات – هيكل السوق مصور
الفراكتلات هو مؤشر تداول مصمم بدقة لـ cTrader يكشف عن البنية الخفية لحركة السعر. من خلال الكشف التلقائي ووضع العلامات على القمم الأعلى (HH)، القيعان الأعلى (HL)، القمم الأدنى (LH)، والقيعان الأدنى (LL) مباشرة على الرسم البياني، يحول الفراكتلات بيانات السعر الخام إلى خريطة واضحة وقابلة للتنفيذ لهياكل السوق.
🔍 الميزات الرئيسية:
- رسم هيكل الوقت الحقيقي: يحدد نقاط التأرجح على الفور ويضع عليها علامات لكشف اتجاه الاتجاه ومناطق الانعكاس.
- الوعي متعدد الأطر الزمنية: مصمم لتسليط الضوء على الهيكل الكلي على الأطر الزمنية الأعلى، مما يمنح المتداولين ميزة استراتيجية في مواءمة الدخول مع الاتجاهات السائدة.
- تحسين متابعة الاتجاه: مثالي للمتداولين الذين يستخدمون استراتيجيات الزخم، الاختراق، أو الارتداد، مما يساعد على تأكيد التحيز وتجنب الفخاخ المضادة للاتجاه.
- تراكب بصري نظيف: تعليقات أنيقة على الرسم البياني تندمج بسلاسة مع أي إعداد تداول، تعزز الوضوح دون ازدحام.
🧭 حالات الاستخدام:
- رصد الاتجاهات الناشئة والتحولات الهيكلية قبل أن تصبح واضحة.
- التحقق من إعدادات التداول بتأكيد هيكلي.
- الدمج مع المتوسطات المتحركة، الحجم، أو المؤشرات المخصصة لتحقيق تلاقي متعدد الطبقات.
- مثالي لـ الاختبار الخلفي اليدوي و تقييمات شركات التداول حيث تكون المنطق القائم على الهيكل هو الأساس.
ملف تعريف المؤشر
4.0
التقييمات: 2
5 | 0 % | |
4 | 100 % | |
3 | 0 % | |
2 | 0 % | |
1 | 0 % |
تقييمات العملاء
August 31, 2025
it gives the trade idea another check, but the result needs a journal.
August 27, 2025
Prop
Forex
Indices
Commodities
Crypto
Stocks
يتم توفير المنتجات المتاحة من خلال cTrader Store، بما في ذلك روبوتات التداول والمؤشرات والإضافات، من قبل مطوري الطرف الثالث وإتاحتها لأغراض الوصول المعلوماتي والفني فقط. cTrader Store ليس وسيطًا ولا يقدم نصائح استثمارية أو توصيات شخصية أو أي ضمان للأداء المستقبلي.


25
المبيعات
2.1K
التثبيتات المجانية