
KaufmanEfficiencyRatio
Индикатор
78 скачивания
Версия 1.0, Sep 2025
Windows, Mac
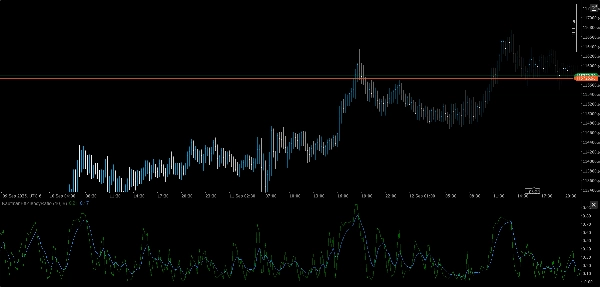
⚡ Коэффициент эффективности Кауфмана (KER)
Ясность тренда, количественно.
Коэффициент эффективности Кауфмана (KER) — это точный инструмент для измерения того, насколько эффективно цена движется от точки А до точки Б — без потерь в шуме. Независимо от того, проверяете ли вы условия прорыва или фильтруете боковой флэт, KER дает вам чистую оценку от 0 до 1, отражающую направленное намерение по сравнению с волатильностью.
🔍 Что он делает
- Вычисляет коэффициент эффективности Кауфмана:
- Выдает нормализованное значение от 0 (чистый шум) до 1 (идеальный тренд)
- Четко выделяет трендовые и нетрендовые режимы без двусмысленности
- Идеален для адаптивных наложений, фильтров режимов и управления сигналами
🛠️ Ключевые особенности
- Модульный менеджер входных данных для мультивременного анализа
- Совместимость с разными активами: FX, криптовалюты, индексы, акции
- Легкая, работающая в реальном времени логика без задержек сглаживания
- Простое подключение к вашей существующей архитектуре набора инструментов
🎯 Сценарии использования
- Подтверждение тренда: Подтверждайте направленную тенденцию перед выполнением сигнала
- Фильтрация шума: Подавляйте входы во время неэффективного движения цены
- Обнаружение режимов: Используйте вместе с наложениями, учитывающими волатильность, для более умных переходов
- Построение стратегий: Используйте как основной показатель в логике прорыва, импульса или смещения
💡 Бонус
KER бесплатен, быстр и безжалостно эффективен — как и ваш код. Никакой воды, никаких фильтров. Только чистое рыночное намерение, дистиллированное.
Профиль индикатора
0.0
Отзывы: 0
Отзывы покупателей
У этого продукта еще нет отзывов. Уже попробовали его? Поделитесь впечатлениями!
Breakout
Scalping
AI
Продукты, доступные в cTrader Store, включая торговых ботов, индикаторы и плагины, предоставляются сторонними разработчиками и доступны исключительно в информационных и технических целях. cTrader Store не является брокером и не предоставляет инвестиционные консультации, персональные рекомендации или какие-либо гарантии будущей доходности.


25
Продажи
2.1K
Бесплатные установки