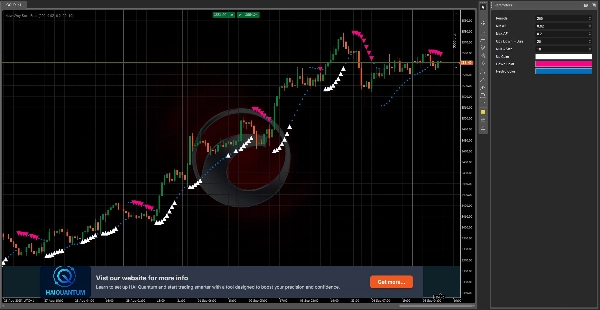
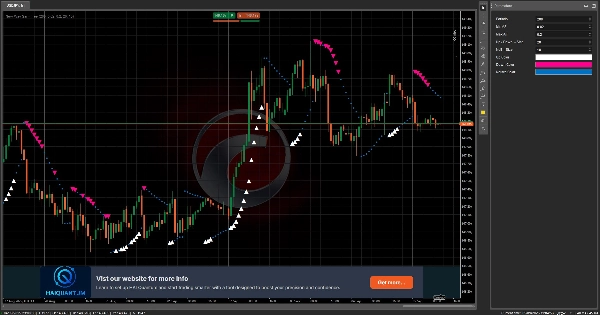
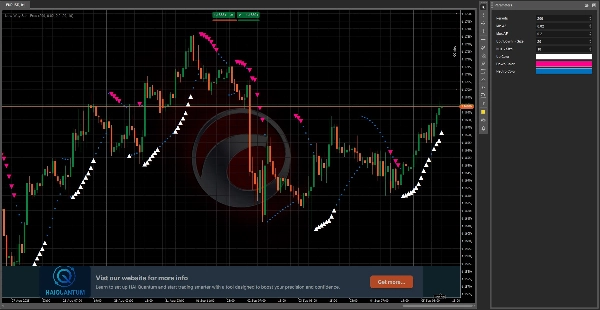
Логотип продукта "New Way Sar - Free"
New Way Sar - Free
5.0
Отзывы: 1
Загруженное изображение продукта "New Way Sar - Free"
135
Продажи
10.47K
Бесплатные установки

The Parabolic SAR, or "Stop and Reverse," is a dynamic technical analysis tool that helps traders identify potential trend reversals and set trailing stop-loss orders. Unlike traditional indicators, the Parabolic SAR creates a series of dots that follow the price movement, adjusting as the trend gains momentum.

Our modern version offers a fresh, intuitive approach to this classic indicator. By combining powerful, reliable signals with a clean and modern design, it helps traders easily visualize trend direction and potential entry or exit points. Whether you're a seasoned trader or just starting out, the Parabolic SAR: Modern Version provides the clarity and precision you need to navigate the markets with confidence.

Профиль индикатора
5.0
Отзывы: 1
5
100 %
4
0 %
3
0 %
2
0 %
1
0 %
Отзывы покупателей
October 8, 2025
A fresh twist on the classic SAR! ⚙️ Fast, light, and easy to read. Great for spotting quick trend flips, but add filters to avoid false turns on choppy markets."
Prop
Forex
Signal
Indices
Commodities
Supertrend
Crypto
Stocks
Продукты, доступные в cTrader Store, включая торговых ботов, индикаторы и плагины, предоставляются сторонними разработчиками и доступны исключительно в информационных и технических целях. cTrader Store не является брокером и не предоставляет инвестиционные консультации, персональные рекомендации или какие-либо гарантии будущей доходности.

Больше от этого автора

Логотип продукта "VWAP-Free"
5.0
(2)
Бесплатно
VWAP only timeframe
Логотип продукта "MarketSession-MX"
4.3
(3)
$ 19
😎Read the description before purchasing💩
This indicator consists of 3 moving averages that can be configured to your liking, from the type of moving average....
Логотип продукта "RangeBoxLevel"
5.0
(1)
$ 19
This technical analysis indicator provides information on market sentiment, trend and price levels....
This bot can automatically generate buy and sell orders based on three specific Fixed bugs.
Логотип продукта "MACDVolume"
5.0
(3)
$ 19
😎Read the description before purchasing💩
Логотип продукта "AllPattern"
5.0
(2)
Бесплатно
🔍 Discover All Candlestick Patterns… Absolutely Free!
Логотип продукта "RangeBoxFibonacci"
5.0
(1)
$ 19
With this Fibonacci retracement indicator, traders have full control over the retracement levels displayed on the chart.
Session One is a tool for marking from to, useful if you've set the hours you want to trade
Логотип продукта "OrderPrice-V3"
5.0
(1)
$ 19
A straightforward yet effective tool signals entry points for both buying and selling. Include 3 Moving Average
Логотип продукта "PRC Momentum Hybrid"
5.0
(2)
Бесплатно
a visually very powerful tool for analyzing "opposing forces".
🚀 HAI QUANTUM v4.0 | The Ultimate Quantum Terminal for cTrader (Smart Money & Algorithmic Trading)

Вам также может понравиться

It identifies areas of market imbalance (Fair Value Gaps or FVGs) and projects them on the chart in a smart way
Buy and Sell Signals
US Dollar Index
Логотип продукта "Supertrend-algo"
$ 19
/
$29
Algorithmic trend precision for cTrader.
Power of Three indicator reveals accumulation, manipulation, and distribution phases for precise intraday timing.
Pro Inside Bar Scanner with smart Telegram alerts & multi-timeframe dashboard
Master volatility! ATR with visual alerts for precise trades and professional stops. Profit with clarity.
Designed to identify and visualize price reversal patterns using Bézier curves.
Shows BUY & SELL signals for 3 & 4 BAR PATTERN (Morning star/ Evening star). It is adjustable and it will SHOW ARROWS.
identify and highlight temporary market inefficiencies known as "fair value gaps" 🚨 within specific trading Sessions.
📊 Visualize market trends more clearly and dynamically
Логотип продукта "BarSentiments"
5.0
(2)
Бесплатно
This Indicator is a technical analysis tool that measures the strength and direction of market sentiment
The TrendFibonacci indicator is a powerful tool for traders, combining Fibonacci retracement levels
Логотип продукта "MainChart_EMA_BB_PSAR"
$ 39
/
$75
This indicator combines trend, volatility, and momentum continuation logic into one overlay:
An exponential moving average based on regular trading hours.
Логотип продукта "Powells Key levels 4H Candle closures"
5.0
(1)
$ 25
Key NY session opens for NASDAQ (US100) & SP500 to find Tick Precise Entrys for High R:R intraday setups.
Логотип продукта "MACD Indicator NDH"
5.0
(2)
Бесплатно
MACD Indicator with Histogram that plots Colors Based on Direction Above and Below the Zero Line.
Trendlines That Adapt. Breakouts That Matter.
135
Продажи
10.47K
Бесплатные установки