

Описание
Продвинутый индикатор MACD с динамическим изменением цвета и объемом
Описание: Наш продвинутый индикатор MACD — это не просто простой гистограммный индикатор. Этот индикатор разработан для предоставления четкого и динамичного отображения рыночных тенденций с уникальными функциями, которые делают его незаменимым для любого серьезного трейдера.
Ключевые особенности:
- Динамическое изменение цвета:
-
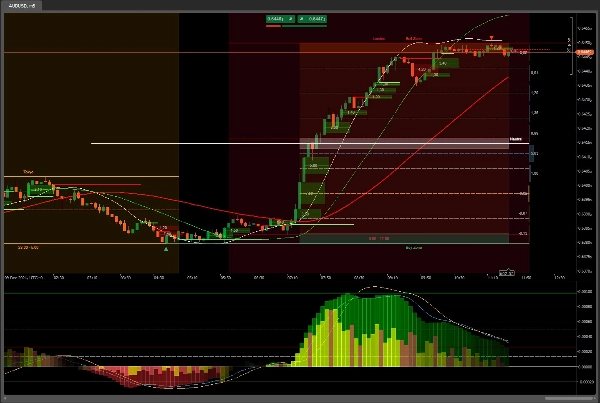
- Положительное: Гистограмма меняет цвет с зеленого на белый по мере увеличения значений, обеспечивая четкую визуализацию бычьих трендов.
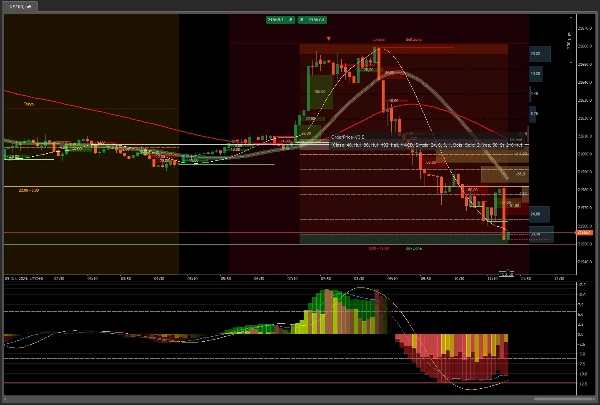
- Отрицательное: Гистограмма меняет цвет с красного на белый по мере уменьшения значений, выделяя медвежьи тренды.
- Индикатор объема:
-
- Положительный объем: Представлен зелеными столбцами, указывающими на увеличение объема торгов.
- Отрицательный объем: Представлен красными столбцами, указывающими на уменьшение объема торгов.
- Четкая визуализация: Сочетание цветов в столбцах объема (зеленый, желтый, коричневый, красный) обеспечивает ясное представление о покупательской и продавательской активности на рынке.
- Автоматическое масштабирование:
-
- Поддерживает индикатор в центре и автоматически подстраивает для оптимального просмотра без необходимости постоянных ручных настроек.
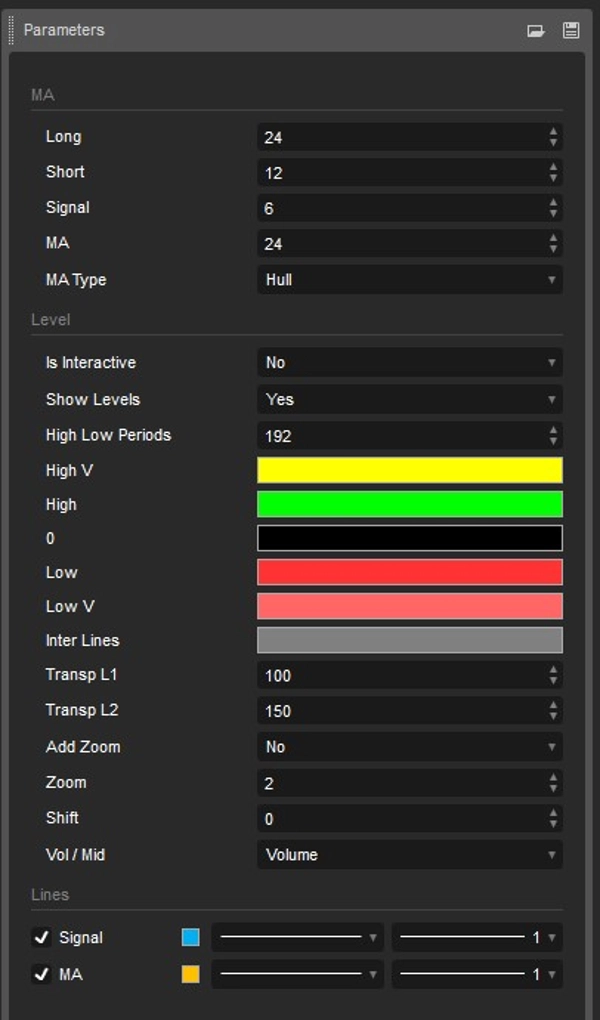
- Настраиваемая скользящая средняя:
-
- Включает дополнительную скользящую среднюю, которую вы можете выбрать из доступных опций, что позволяет лучше адаптировать индикатор под вашу торговую стратегию.
- Максимумы и минимумы:
-
- Отображает самые высокие и низкие уровни за выбранный период, предоставляя четкое представление о рыночных экстремумах.
Преимущества:
- Визуальная ясность: Динамическое изменение цвета облегчает идентификацию трендов и точек разворота на рынке.
- Настраиваемость: Возможность выбора различных скользящих средних и настройки уровней цвета позволяет адаптировать индикатор под ваши конкретные потребности.
- Эффективность: Автоматическое масштабирование гарантирует, что у вас всегда будет лучший обзор индикатора без необходимости ручных настроек.
- Комплексный анализ: Включение объема и уровней максимумов/минимумов обеспечивает более полное представление о рынке.
Идеально подходит для:
- Трейдеров, ищущих продвинутый и настраиваемый инструмент для улучшения технического анализа.
- Тех, кто хочет четкую и динамичную визуализацию рыночных тенденций.
- Пользователей, ценящих эффективность и настройку в своих торговых инструментах.
С дополнительными инструментами, такими как
OrderPrice V3 https://ctrader.com/products/397
NTMPICLL https://ctrader.com/products/327
Range Box Level https://ctrader.com/products/245
Или RangeBoxFibonacci https://ctrader.com/products/526
Market Session https://ctrader.com/products/525
MacdVolume https://ctrader.com/products/267
4MA https://ctrader.com/products/247
Вы будете непобедимы
Удачи 😀
Сводка
Key functionalities include auto zoom, which keeps the indicator centered and optimally scaled without manual adjustment, and a customizable moving average that can be selected from available options to fit different trading strategies. The indicator also displays the highest and lowest price levels within the selected period, providing insight into market extremes.
Designed for traders seeking a customizable and efficient tool, MACDVolume offers clear visual cues for trend identification and comprehensive market analysis by integrating volume and price extremes. It supports markets such as Forex and Stocks and is suitable for users who prioritize clarity, customization, and efficiency in their technical indicators.
Отзывы покупателей
5 | 100 % | |
4 | 0 % | |
3 | 0 % | |
2 | 0 % | |
1 | 0 % |


