
Mô tả
Chỉ báo phân tích kỹ thuật này cung cấp thông tin về tâm lý thị trường, xu hướng và các mức giá. Nó sử dụng dữ liệu như Khối lượng, Open_Close, Độ biến động Chaikin và Dòng tiền Chaikin để tính toán tâm lý thị trường. Nó cũng cho phép bạn điều chỉnh khoảng cách, phát hiện xu hướng và trực quan hóa các mức giá và pip. Đây là một công cụ hữu ích để xác định lực lượng chi phối trên thị trường, dự đoán biến động giá và cải thiện quyết định giao dịch.
Trong phần mô tả, tôi chỉ ra các tham số quan trọng; phần còn lại là cấu hình kiểu dáng như màu sắc, loại đường và kích thước phông chữ.
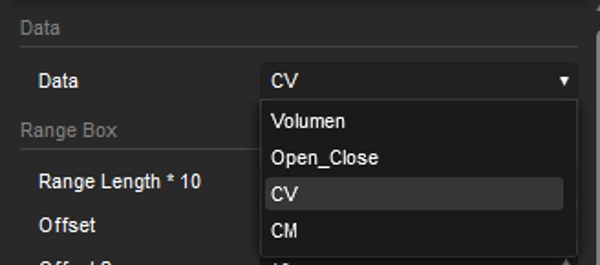
Dữ liệu
Các phép tính tâm lý dựa trên việc chọn từ Khối lượng, Open_Close, Độ biến động Chaikin và Dòng tiền Chaikin.
Chiều dài phạm vi * 10
Giá trị này chỉ số lượng nến (khoảng thời gian) mà phép tính dựa vào – giá trị được nhân với 10.
Thêm Thu phóng
Để giữ biểu đồ ở trung tâm, điều này cũng giúp xem xét các tình huống như hợp nhất và thay đổi xu hướng.
Lề
Cho phép điều chỉnh lề trên và dưới để cải thiện việc trực quan hóa.
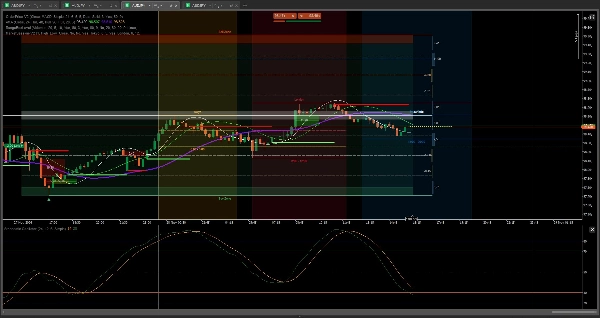
Hiển thị Tâm lý
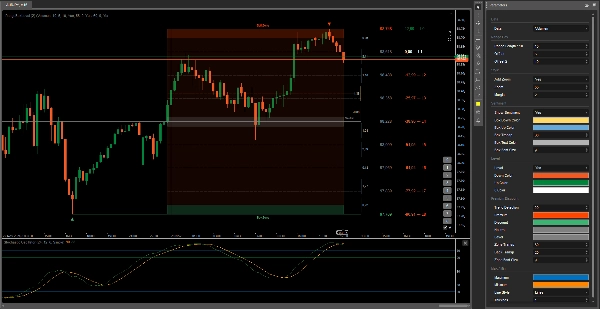
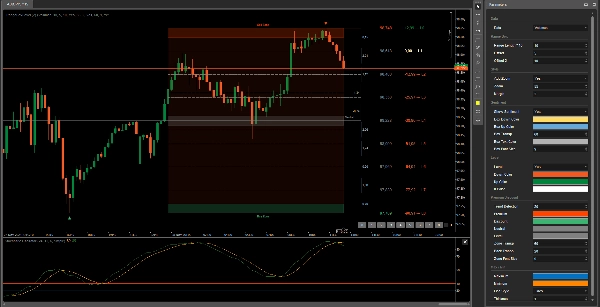
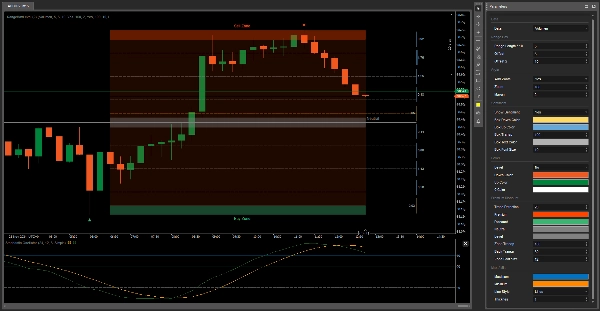
Tâm lý cho biết lực lượng nào mạnh hơn trên thị trường vào thời điểm hiện tại. Nếu các thanh màu vàng tăng kích thước, điều đó có nghĩa là có nhiều người bán hơn, và ngược lại. Nếu bạn không muốn xem trực quan hóa tâm lý, bạn có thể ẩn nó ở phía bên phải.
Mức
Đây là một tính năng bổ sung có thể được sử dụng làm tham chiếu cho giá và pip ở mỗi mức. Khi bạn chọn một mức mà bạn muốn đặt lệnh mua, nó chỉ ra số pip ở mỗi mức mà giá có thể đạt tới.
Phát hiện Xu hướng
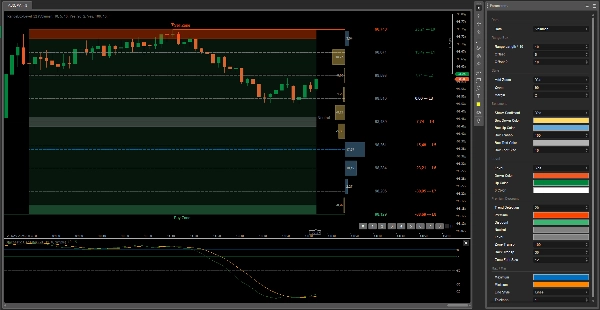
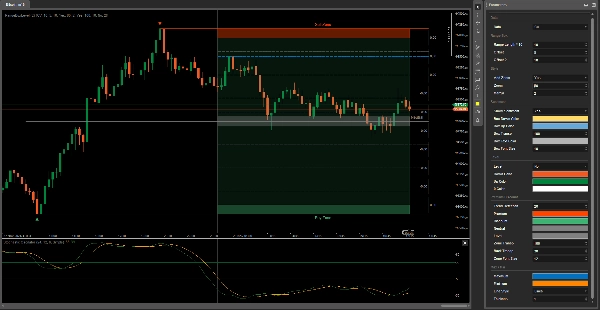
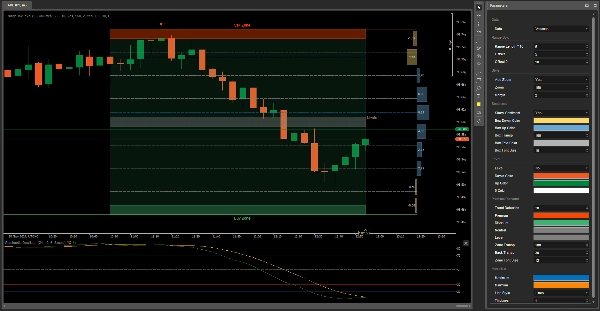
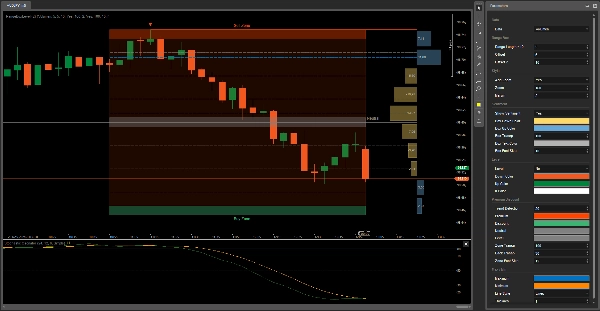
Tùy thuộc vào xu hướng của tài sản, nền của Hộp Phạm vi thay đổi: màu xanh lá nếu là xu hướng tăng và màu đỏ nếu là xu hướng giảm.
Tối đa / Tối thiểu
Đây là các đường màu xanh dương và vàng thay đổi vị trí theo dự đoán nơi giá có thể đi tới. Hộp Phạm vi được chia thành 9 phần để giúp xác định các điểm ngoặt giá, phục vụ như một Fibonacci Retracement.
Bạn sẽ trở nên bất khả chiến bại
Chúc may mắn 😀
Tóm tắt
Đánh giá của khách hàng
5 | 100 % | |
4 | 0 % | |
3 | 0 % | |
2 | 0 % | |
1 | 0 % |


