
Mô tả
FVG MA Color V45 Extended — Biến Biểu Đồ Của Bạn Thành Một Terminal Giao Dịch
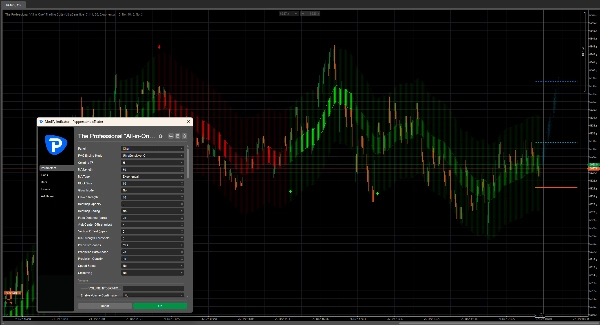
✅ Phát hiện Fair Value Gap theo phong cách tổ chức (Strict_A + UltraSensitive_C)
✅ Kiểm soát hướng khung thời gian cao hơn với hỗ trợ đa TF + tick-TF
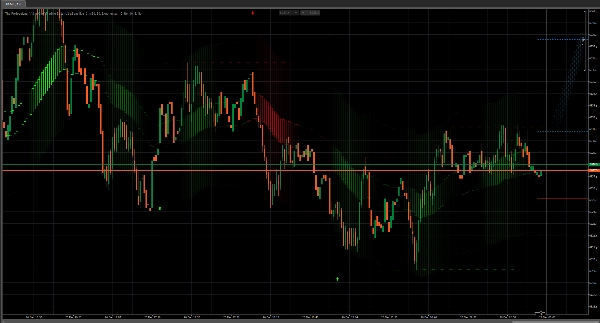
✅ Heatmap + mờ dần + phát sáng để thể hiện sự thống trị trực quan ngay lập tức
✅ Vùng Dự Báo dự đoán trước để tiên đoán hành vi giá
✅ Heatmap Thanh Khoản + Cụm Thanh Khoản để lộ nơi thị trường thực sự quan tâm
✅ Mũi Tên Thông Minh (đảo chiều HTF + vào lệnh pullback) cho những thời điểm quyết định rõ ràng, xác suất cao
✅ Dự Báo TP/SL tùy chọn dựa trên mục tiêu thanh khoản (nhiều chế độ SL)
Đây không phải là một chỉ báo cơ bản.
FVG MA Color V45 Extended là một môi trường giao dịch đầy đủ được xây dựng trực tiếp trên biểu đồ của bạn.
Nó được thiết kế cho các nhà giao dịch đã chán đoán và sẵn sàng nhìn thị trường như một hệ thống — cấu trúc, mất cân bằng (FVG), thanh khoản, thời gian, mục tiêu và khung rủi ro trong một không gian làm việc thống nhất.
Bạn sẽ ngay lập tức thấy:
- nơi mất cân bằng hình thành
- nơi nó được kiểm tra lại
- nơi thanh khoản đang tích tụ
- khi khung thời gian cao hơn đảo chiều
- nơi pullback trở thành điểm vào lệnh chất lượng cao
Ngừng săn tìm “sự hội tụ.” Đặt nó lên biểu đồ và để nó cho bạn thấy sự thật.
Tại sao đây là cấp độ chuyên nghiệp (và tại sao bạn sẽ cảm nhận ngay lập tức)
1) Hai động cơ FVG — chọn phong cách của bạn
Các nhà giao dịch thực sự không giao dịch chỉ một điều kiện thị trường.
- Strict_A → bảo thủ, sạch sẽ, chỉ những vùng “tốt nhất”
- UltraSensitive_C → phát hiện nhanh hơn, mạnh mẽ hơn cho biểu đồ tick & phiên biến động
Bạn điều chỉnh động cơ theo phong cách của mình (scalping, intraday, swing) mà không cần đổi công cụ.
2) Kiểm soát Khung Thời Gian Cao Hơn — giao dịch với tiền lớn, thực thi chính xác
Phần lớn thua lỗ đến từ một điều: sự không đồng bộ.
Chỉ báo này khắc phục bằng cách cho phép bạn chọn một TF Tô Màu (bao gồm các khung thời gian dựa trên tick) để biểu đồ của bạn theo một khung thống trị:
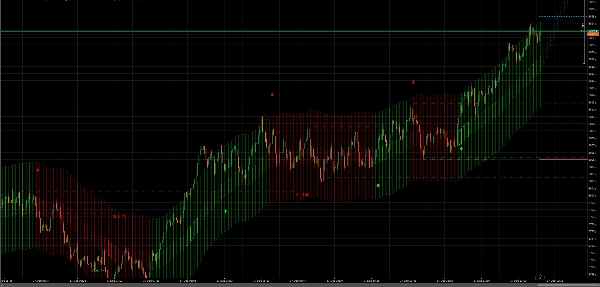
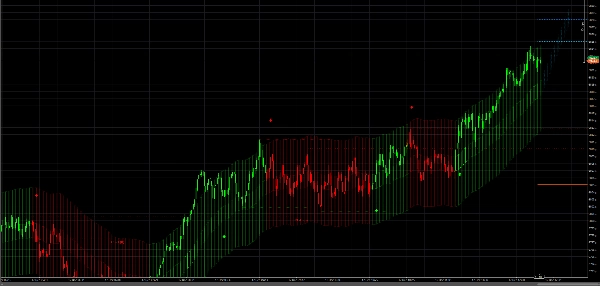
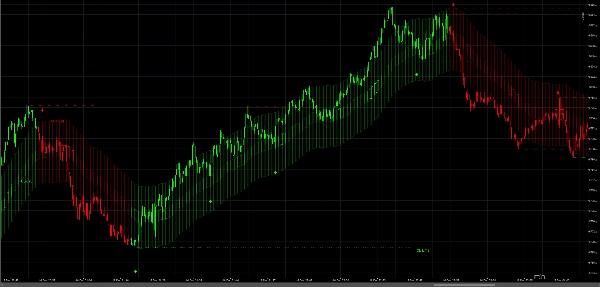
🟢 Chế độ tăng → thiên hướng màu xanh lá
🔴 Chế độ giảm → thiên hướng màu đỏ
Không tín hiệu hỗn hợp. Không nhầm lẫn. Chỉ một la bàn HTF rõ ràng.
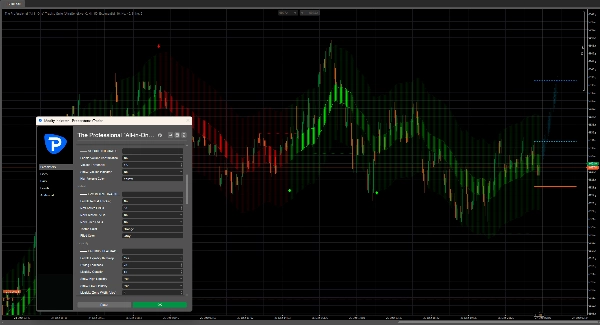
3) Heatmap + Mờ Dần + Phát Sáng — nhìn thấy sức mạnh, không phải tiếng ồn
Heatmap không phải là trang trí — nó là mật độ thông tin.
- Độ mờ Heatmap kiểm soát cường độ
- Mờ dần Heatmap cho phép các vùng cũ tự nhiên phai nhạt (tập trung vào những gì quan trọng hiện tại)
- Chế độ Phát Sáng thêm điểm nhấn “sức mạnh” tinh túy khi điều kiện mạnh mẽ
Kết quả: biểu đồ của bạn trở nên dễ đọc ngay lập tức — sạch sẽ, quyết đoán, thống trị.
4) Vùng Dự Báo — dự đoán thay vì phản ứng
Khi bật, Vùng Dự Báo chiếu về phía trước và vẽ một hành lang xác suất trước giá.
Dành cho các nhà giao dịch muốn định vị trước đám đông, không phải sau.
Sử dụng nó để:
- lập kế hoạch trước cho các đợt pullback
- hình dung các đường tiếp diễn
- phát hiện sớm sự lệch khỏi kỳ vọng
Nó tạo ra cảm giác “Tôi biết điều đó sẽ đến” — một cách trực quan.
5) Động Cơ Thanh Khoản — lớp nam châm ẩn (Heatmap + Cụm)
Giá di chuyển từ thanh khoản này sang thanh khoản khác. Điều này làm cho nó trở nên rõ ràng.
- Heatmap Thanh Khoản đánh dấu thanh khoản swing chính
- Cụm Thanh Khoản hợp nhất các lần chạm lặp lại thành các nam châm tổ chức mạnh hơn
- Các đường/nhãn cụm tùy chọn để hướng dẫn rõ ràng
Đây là nơi nó trở nên cấp độ tiếp theo:
Bạn không giao dịch các cây nến ngẫu nhiên — bạn giao dịch nơi các lệnh tồn tại.
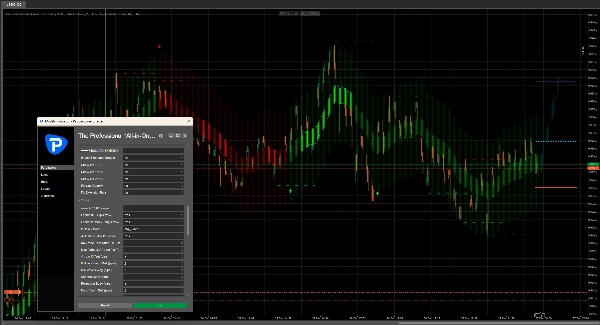
6) Dự Báo TP/SL từ Thanh Khoản — thoát lệnh có cấu trúc không đoán mò
Khi bật, hệ thống có thể dự báo:
- TP1 / TP2 hướng tới các mục tiêu thanh khoản
- SL qua logic có thể chọn:
-
- Thanh Khoản Đối Diện
- Swing Cuối
- ATR
- Hybrid (pha trộn thông minh)
Điều này biến biểu đồ của bạn thành một trạm lập kế hoạch rủi ro, không chỉ là một công cụ vào lệnh.
Các tùy chọn bổ sung (nếu bật): cập nhật TP/SL trên các thanh HTF mới, tự động loại bỏ khi đảo chiều xu hướng, theo dõi trúng đích, logic BE, v.v.
7) Hệ Thống Mũi Tên — tín hiệu rõ ràng với thời điểm chuyên nghiệp
Bạn có hai loại mũi tên mạnh mẽ:
- Mũi Tên Đảo Chiều HTF → khoảnh khắc “chế độ thay đổi”
- Mũi Tên Vào Lệnh Pullback → kích hoạt chất lượng cao bên trong xu hướng
Các chế độ pullback không phải là chiêu trò — chúng là phong cách logic giao dịch thực sự:
- Chạm MA
- Kiểm tra lại FVG
- Rìa Dải
- Rút lại ATR
- TẤT CẢ (xác nhận đa phương pháp + giới hạn thông minh)
Và bạn có thể kiểm soát nó như một chuyên gia: cửa sổ không giao dịch, số mũi tên tối đa mỗi xu hướng, yêu cầu từ chối, bộ lọc khoảng cách, thanh xác nhận — để bạn không bị spam bởi rác muộn.
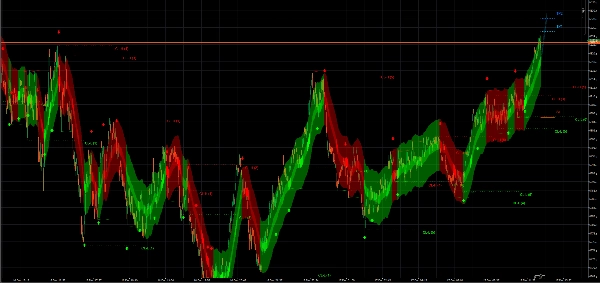
8) Tô Màu Nến Tùy Chọn — rõ ràng toàn biểu đồ
Bật nó lên và nến của bạn sẽ phù hợp với màu chế độ hiện tại — hoàn hảo cho tốc độ và ra quyết định, đặc biệt trên biểu đồ tick.
9) Chế Độ Hiệu Suất — tính năng nặng, thực thi mượt mà
Chỉ báo này có thể vẽ nhiều vì nó làm nhiều việc.
Chế Độ Hiệu Suất giữ cho nó nhanh và ổn định bằng cách giới hạn việc vẽ hoạt động một cách thông minh.
Tư duy “chỉ báo duy nhất bạn sẽ cần” — với sự kiểm tra thực tế chuyên nghiệp
Công cụ này được xây dựng để thay thế một chồng chỉ báo bằng cách kết hợp tất cả thành một hệ thống thống nhất:
xu hướng + mất cân bằng + thanh khoản + điểm vào + mục tiêu + cấu trúc rủi ro + sự rõ ràng trực quan.
Nếu bạn muốn một biểu đồ không còn trông như một trò chơi đoán mò mà bắt đầu trông như một trạm làm việc chuyên nghiệp — thì đây chính là nó.
Tóm tắt
Key features include higher-timeframe direction control with multi-timeframe and tick-timeframe support, providing a clear market regime bias. The suite offers a heatmap with fading and glow effects to visually emphasize market strength and dominance. Predictive Zones project probable price paths forward, enabling traders to anticipate market moves.
A liquidity engine highlights key liquidity areas and clusters, revealing where institutional orders concentrate. Optional take-profit and stop-loss projections are based on liquidity targets with multiple stop-loss modes, supporting structured risk management. The system includes smart arrows signaling higher-timeframe flips and high-quality pullback entries, customizable with various trade logic styles.
Additional functionalities include optional candle coloring aligned with market regimes and a performance mode to maintain smooth execution despite heavy chart drawing. This indicator consolidates trend, imbalance, liquidity, entries, targets, and risk structure into one integrated workspace for professional-level market analysis and decision-making.
Đánh giá của khách hàng
5 | 50 % | |
4 | 50 % | |
3 | 0 % | |
2 | 0 % | |
1 | 0 % |


