VWAP-Free
Indicateur
1.69K téléchargements
Version 1.0, Jul 2025
Windows, Mac
5.0
Avis : 2
Description
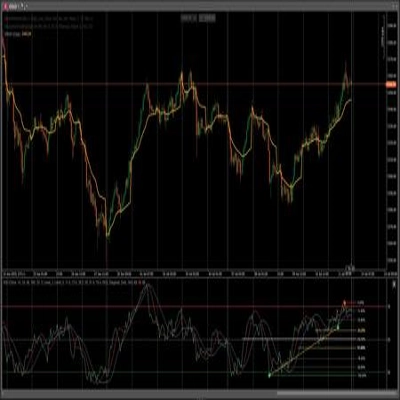
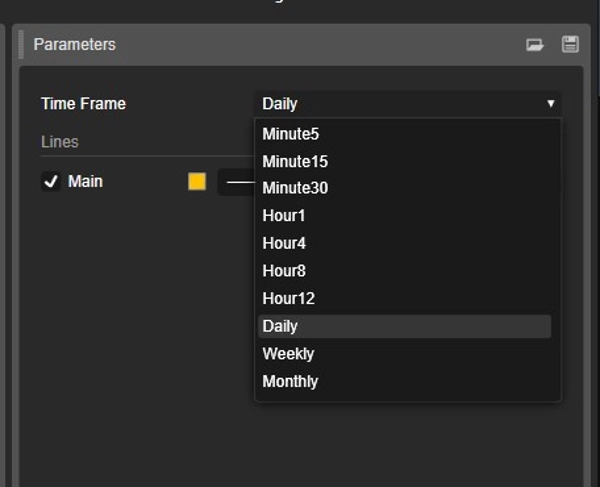
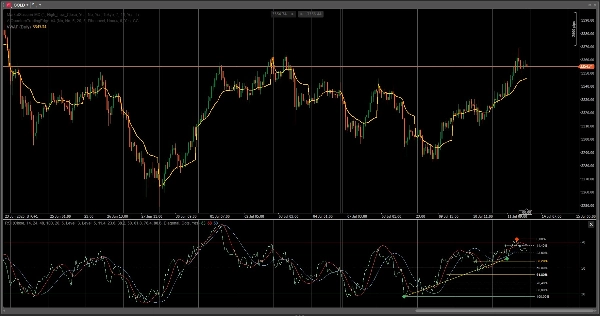
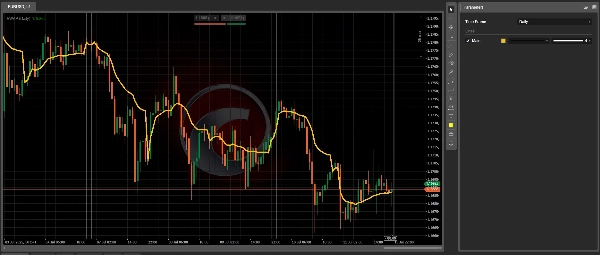
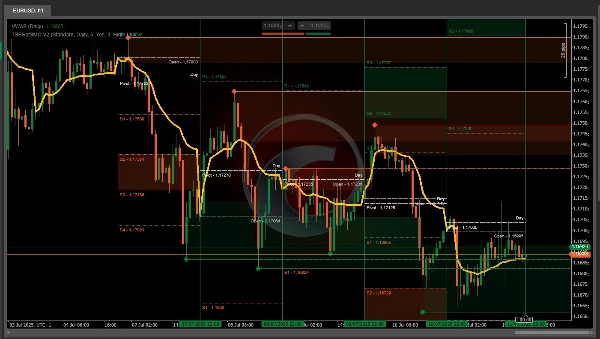
VWAP uniquement TimeFrame rien de plus.
Résumé
Résumé IA
VWAP-Free is a technical indicator focused exclusively on the Volume Weighted Average Price (VWAP) for a single timeframe. It provides traders with a clear VWAP calculation without additional features or complexity. This tool is designed to simplify analysis by presenting only the VWAP data, aiding in understanding price trends relative to volume over the chosen timeframe. It is categorized under volume-based indicators and supports integration within trading platforms that utilize such indicators.
Profil de l'indicateur
Avis clients
5.0
Avis : 2
5 | 100 % | |
4 | 0 % | |
3 | 0 % | |
2 | 0 % | |
1 | 0 % |
Avis clients
December 5, 2025
Thank you Mr. Thomas Sparrow , finally could put it to work , thank you for sharing
December 5, 2025
Thank You Mr.Thomas Sparrow , i could see where i did wrong , thank you for sharing this wonderfull tool
Discussion
Questions fréquentes
VWAP
Les produits disponibles sur cTrader Store, notamment les bots de trading, les indicateurs et les plug-ins, sont fournis par des développeurs tiers et mis à disposition à titre informatif et à des fins d'accès technique uniquement. cTrader Store n'est pas un courtier et ne fournit aucun conseil en investissement, aucune recommandation personnelle ni aucune garantie quant aux performances futures.


Prix
147
Ventes
11.17K
Installations gratuites