

Description
Indicateur MACD Avancé avec Changement de Couleur Dynamique et Volume
Description : Notre indicateur MACD avancé n'est pas simplement un histogramme. Cet indicateur est conçu pour offrir une vue claire et dynamique des tendances du marché, avec des fonctionnalités uniques qui le rendent indispensable pour tout trader sérieux.
Caractéristiques principales :
- Changement de couleur dynamique :
-
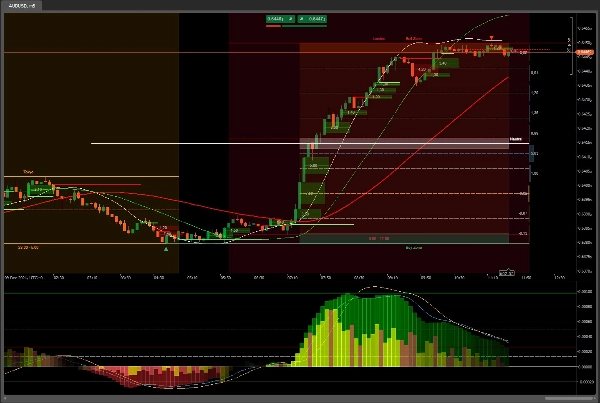
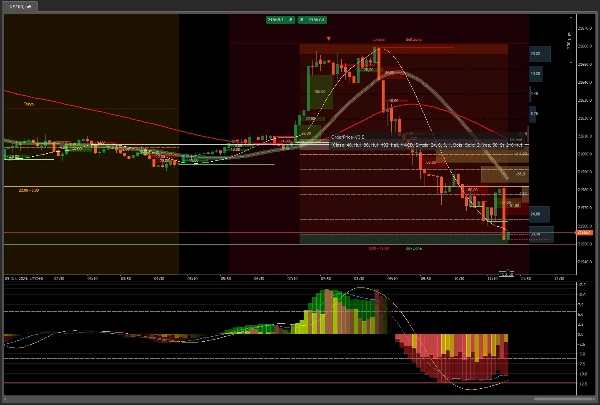
- Positif : L'histogramme passe du vert au blanc à mesure que les valeurs augmentent, offrant une visualisation claire des tendances haussières.
- Négatif : L'histogramme passe du rouge au blanc à mesure que les valeurs diminuent, mettant en évidence les tendances baissières.
- Indicateur de volume :
-
- Volume positif : Représenté par des barres vertes, indiquant une augmentation du volume des échanges.
- Volume négatif : Représenté par des barres rouges, indiquant une diminution du volume des échanges.
- Visualisation claire : La combinaison des couleurs dans les barres de volume (vert, jaune, marron, rouge) offre une vue claire de l'activité d'achat et de vente sur le marché.
- Zoom automatique :
-
- Maintient l'indicateur centré et automatiquement ajusté pour une visualisation optimale, sans besoin de réglages manuels constants.
- Moyenne mobile personnalisable :
-
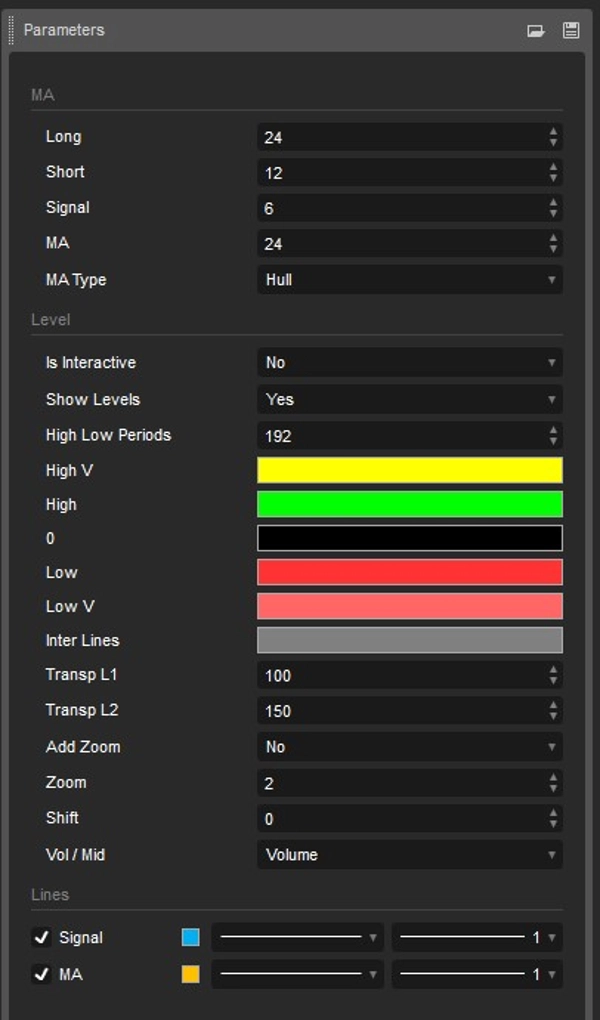
- Intègre une moyenne mobile supplémentaire que vous pouvez sélectionner parmi les options disponibles, permettant une plus grande personnalisation et adaptation à votre stratégie de trading.
- Hauts et bas :
-
- Affiche les niveaux les plus hauts et les plus bas de la période sélectionnée, offrant une vue claire des extrêmes du marché.
Avantages :
- Clarté visuelle : Les changements de couleur dynamiques facilitent l'identification des tendances et des points de retournement sur le marché.
- Personnalisation : La possibilité de sélectionner différentes moyennes mobiles et d'ajuster les niveaux de couleur vous permet d'adapter l'indicateur à vos besoins spécifiques.
- Efficacité : Le zoom automatique garantit que vous avez toujours la meilleure vue de l'indicateur sans besoin de réglages manuels.
- Analyse complète : L'inclusion du volume et des niveaux hauts/bas offre une vue plus complète du marché.
Idéal pour :
- Les traders recherchant un outil avancé et personnalisable pour améliorer leur analyse technique.
- Ceux qui veulent une visualisation claire et dynamique des tendances du marché.
- Les utilisateurs qui valorisent l'efficacité et la personnalisation dans leurs outils de trading.
Avec des outils supplémentaires comme
OrderPrice V3 https://ctrader.com/products/397
NTMPICLL https://ctrader.com/products/327
Range Box Level https://ctrader.com/products/245
Or RangeBoxFibonacci https://ctrader.com/products/526
Market Session https://ctrader.com/products/525
MacdVolume https://ctrader.com/products/267
4MA https://ctrader.com/products/247
Vous serez invincible
Bonne chance 😀
Résumé
Key functionalities include auto zoom, which keeps the indicator centered and optimally scaled without manual adjustment, and a customizable moving average that can be selected from available options to fit different trading strategies. The indicator also displays the highest and lowest price levels within the selected period, providing insight into market extremes.
Designed for traders seeking a customizable and efficient tool, MACDVolume offers clear visual cues for trend identification and comprehensive market analysis by integrating volume and price extremes. It supports markets such as Forex and Stocks and is suitable for users who prioritize clarity, customization, and efficiency in their technical indicators.
Avis clients
5 | 100 % | |
4 | 0 % | |
3 | 0 % | |
2 | 0 % | |
1 | 0 % |


