
Description
Dynamiques Avancées de Tendance avec les Bandes de Bollinger de l'Oscillateur
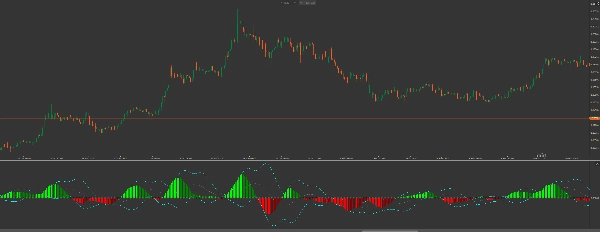
La Squeeze Pro : Suite Momentum & Volatilité est un ensemble d'outils de qualité institutionnelle pour cTrader. Contrairement aux indicateurs standards, cette suite fournit une analyse à double couche du comportement du marché : elle identifie la Phase de Squeeze (compression du marché) et surveille les Extrêmes de Momentum en utilisant les Bandes de Bollinger calculées directement sur l'oscillateur lui-même.
Innovations Clés
-
- Bandes de Bollinger Momentum : Les premières du genre. En appliquant les BBs à l'histogramme de momentum, vous pouvez identifier les niveaux de momentum "suracheté" ou "survendu" — parfait pour synchroniser les sorties avant que la tendance ne s'épuise.
- Détection de Squeeze à Trois États :
-
- Points Noirs (Squeeze Activé) : Forte compression. Le marché est en "tension" pour une cassure massive.
- Points Gris (Squeeze Désactivé) : La volatilité s'élargit. Le mouvement a commencé.
- Points Bleus (Pas de Squeeze) : Conditions normales du marché.
- Lissage par Régression Linéaire : Utilise un algorithme
CalculateLinearRegressionaffiné pour filtrer le bruit des prix, offrant un histogramme lisse et fiable. - Logique à Double Superposition : Fonctionne dans une fenêtre d'indicateur séparée pour garder votre graphique de prix propre tout en fournissant des analyses approfondies.
Guide d'Intelligence Visuelle :
-
- L'Histogramme (Tendance & Force)
-
- Citron Vert : Le momentum haussier s'accélère (Forte Achat).
- Vert : Le momentum haussier ralentit (Prise de bénéfices).
- Rouge : Le momentum baissier s'accélère (Forte Vente).
- Bordeaux : Le momentum baissier ralentit (Vendeurs épuisés).
- Les Bandes de l'Oscillateur (Les lignes "Cyan")
-
- Lorsque les barres de l'histogramme dépassent les Bandes de Bollinger Cyan, la tendance actuelle est à un extrême statistique. Cherchez des retournements ou des replis majeurs lorsque l'histogramme commence à revenir à l'intérieur de ces bandes.
Stratégie de Trading : Le "Power Breakout"
-
- Identifier le Squeeze : Attendez que Points Noirs apparaissent sur la ligne zéro. Cela indique le "calme avant la tempête".
- Confirmer la Direction : Cherchez la première barre d'histogramme Citron Vert (Achat) ou Rouge (Vente).
- Le Déclencheur : Entrez dans la transaction lorsque le Squeeze Désactivé (point gris) apparaît, signalant la libération d'énergie.
- La Sortie : Prenez des profits lorsque l'histogramme passe de Citron Vert à Vert, OU lorsque l'histogramme atteint la Bande Supérieure de l'Oscillateur, signalant l'épuisement.
Pourquoi passer à Squeeze Pro ?
Alors que les indicateurs basiques vous montrent où le prix est allé, Squeeze Pro vous montre la pression derrière le mouvement. En voyant simultanément le squeeze et les bandes de momentum, vous évitez d'entrer dans des tendances déjà épuisées et capturez les mouvements explosifs que d'autres manquent.
Note du Développeur : Cet indicateur est hautement optimisé pour l'API de cTrader, garantissant zéro latence de performance même sur des machines d'entrée de gamme tout en gérant des calculs complexes de régression linéaire en temps réel.
Résumé
Key features include linear regression smoothing to reduce price noise, a dual-overlay display that keeps the price chart uncluttered, and a color-coded histogram that visually represents bullish and bearish momentum strength and changes. When histogram bars move outside the oscillator’s Bollinger Bands (cyan lines), it signals statistically extreme momentum levels, useful for timing entries and exits.
The indicator supports a "Power Breakout" trading strategy: traders wait for squeeze signals, confirm momentum direction via histogram colors, enter trades on squeeze release, and exit when momentum shows signs of exhaustion. This suite provides institutional-grade insights into trend pressure and momentum dynamics, helping traders identify potential explosive moves and avoid exhausted trends.
Avis clients
5 | 0 % | |
4 | 100 % | |
3 | 0 % | |
2 | 0 % | |
1 | 0 % |


![Logo de "[Hamster-Coder] Pivot Points MTF"](https://cdn.ctrader.com/image/webp/4c143e5a-309c-40e3-a578-f04d1e133ffa_31159)


