

说明
cTrader 自动趋势线指标 – 即刻解锁市场趋势!
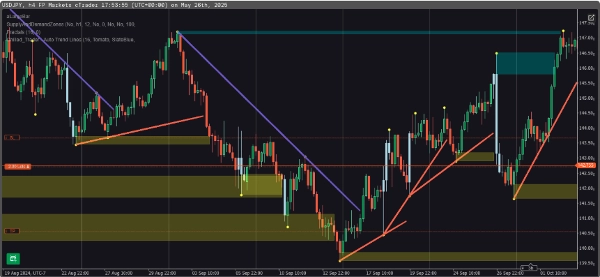
通过 自动趋势线指标 将您的交易提升到新高度——这是一款强大的工具,旨在 自动检测并绘制趋势线 于您的 cTrader 图表上。无需再手动绘制趋势线——让智能算法精准识别关键市场趋势。
功能特点:
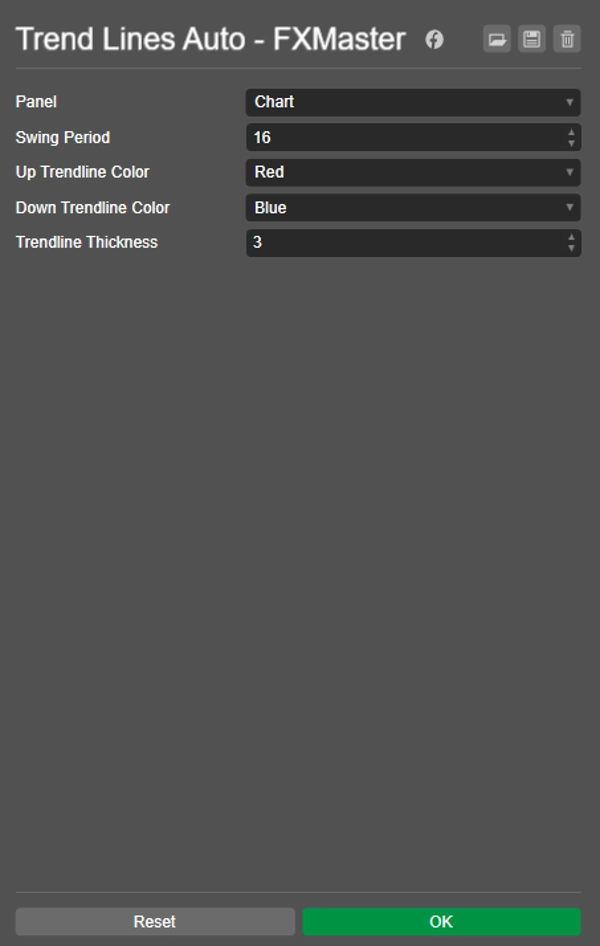
✅ 自动趋势检测 – 无需猜测!指标扫描价格动作并即时绘制趋势线。 ✅ 可自定义阈值 – 设置灵敏度以检测重要市场趋势。 ✅ 清晰视觉效果 – 选择您偏好的 线条粗细和颜色,确保图表易读。 ✅ 实时更新 – 通过动态调整的趋势线,领先市场变化。 ✅ 适用于任何市场 – 可用于外汇、股票、商品或加密货币——适配所有时间框架。
为何选择此指标?
- 自信交易 – 在重大趋势反转发生 之前捕捉到它们。
- 节省时间 – 无需手动分析趋势结构。
- 提升准确性 – 帮助交易者基于强趋势确认 优化进出场点。
💡 兼容 cTrader 平台 – 为专业交易者轻松集成。
🔹 立即掌控您的交易! 获取 cTrader 自动趋势线指标,轻松掌握趋势分析。🚀
摘要
AI 摘要
The Auto Trend Line Indicator for cTrader is a tool designed to automatically detect and plot trend lines on trading charts, eliminating the need for manual drawing. It analyzes price action in real time to identify key market trends across various markets including Forex, Stocks, Commodities, Indices, and Crypto, and is adaptable to all timeframes.
Key features include:
- Automatic trend detection with customizable sensitivity thresholds.
- Clear visual customization options for line thickness and colors.
- Dynamic updates that adjust trend lines as market conditions change.
- Compatibility with the cTrader platform for seamless integration.
This indicator aims to help traders identify major trend reversals early, save time by automating trend analysis, and improve trading accuracy by confirming strong trends for better entry and exit decisions.
指标配置
客户评价
4.3
评价:3
5 | 33 % | |
4 | 67 % | |
3 | 0 % | |
2 | 0 % | |
1 | 0 % |
客户评价
May 29, 2025
Nice tool for context around trendline alerts. The useful part is tracking manual levels and alerting reactions, with the numbers checked before scaling. I would track 3 clean reactions per line and skip alerts far away from structure. The alert is useful only when the line itself was worth drawing.
May 28, 2025
May 28, 2025
Worth checking slowly if the trader wants it helps watch important lines without staring at the chart all day. It works best as support, not a final decision maker. It works better with 2 or 3 major lines, not 20 drawings across the chart. poorly placed lines can still create noise.
讨论
常见问答
Forex
Breakout
Indices
Commodities
Crypto
Stocks
cTrader Store 提供的所有产品,包括交易机器人、指标和插件,均由第三方开发者提供,仅供信息参考和技术访问之用。cTrader Store 并非经纪商,不提供投资建议、个人推荐或任何未来业绩保证。


价格
注册日期 11/01/2025
19
销售