
Channel Breakout System
指标
1 购买
版本 1.0, Mar 2025
Windows 版、Mac 版
4.3
评价:3
说明
🚀 通道突破系统
这个 专用算法 旨在通过结合多种技术分析元素,精准地 确认进出点 🎯,提供可靠的信号。
🔍 它是如何工作的?
📊 基于波动率的通道(ATR)
✅ 市场波动率通过 ATR(平均真实波幅) 📉 计算。
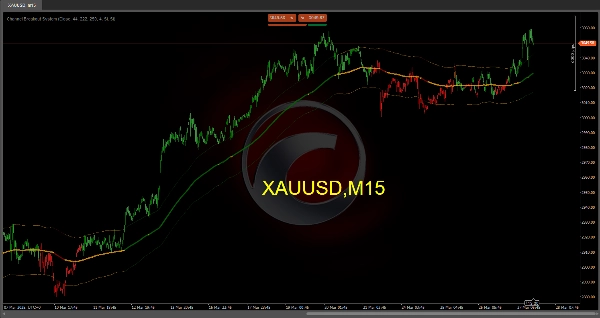
✅ “趋势均线”通过加减与波动率成比例的数值进行调整,形成 两条虚线,作为市场的 “天花板”和“地板”。
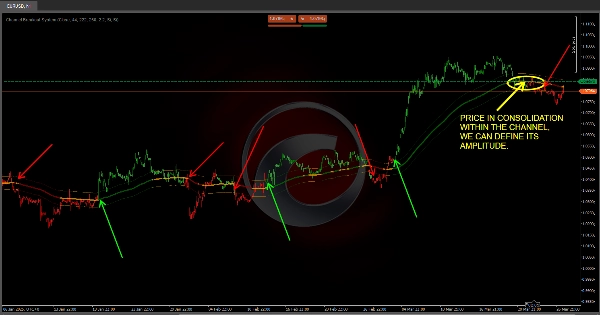
✅ 这对你意味着什么? 如果价格保持在通道内,市场可能处于盘整或整合阶段;如果明显突破,则是 强劲趋势运动 📈📉 的信号。
✅ 完全可定制! 调整通道设置以匹配你的策略 📌。
🟢 智能颜色趋势检测
🔹 指标比较 快速均线 与 中期均线 的位置,以及两者相对于 趋势均线 的关系。
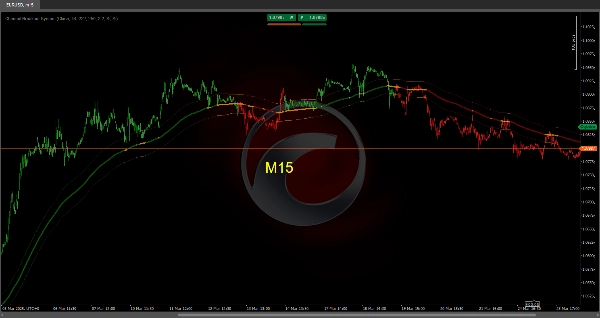
🔹 根据市场阶段,蜡烛颜色变化:
- 🟢 绿色 → 牛市阶段。
- 🔴 红色 → 熊市阶段。
- 🟠 橙色或中性 → 可能的盘整或不确定性。
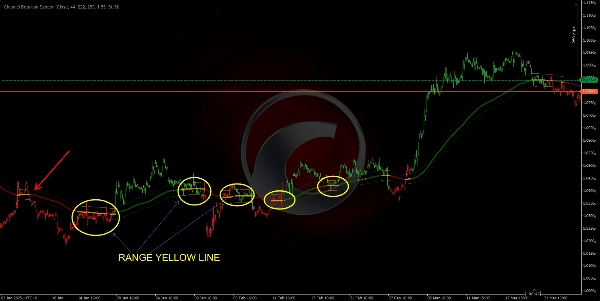
🔹 如果价格和移动均线“卡”在通道内,表示 盘整阶段,帮助你避免在犹豫区域交易。
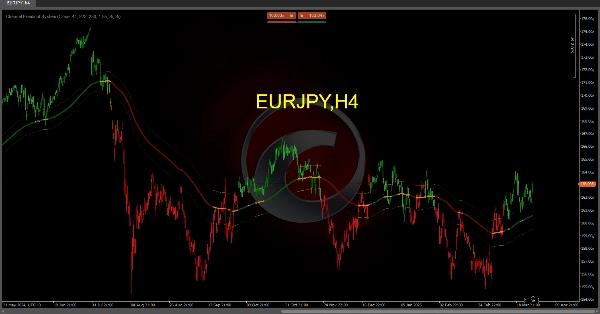
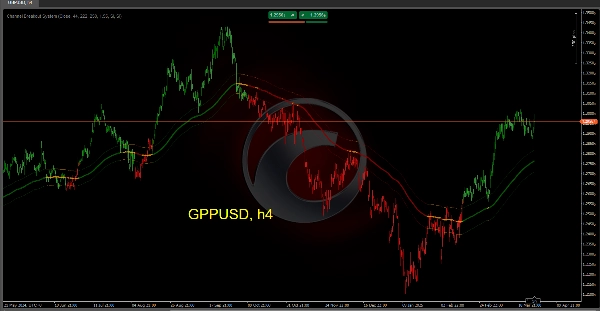
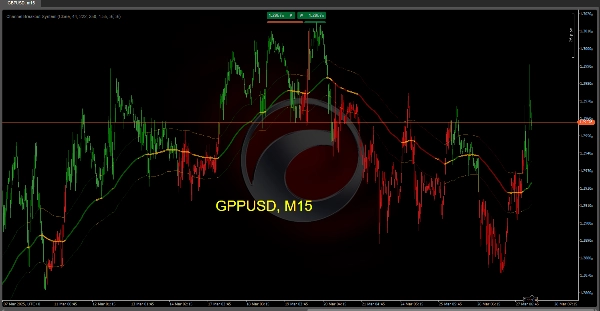
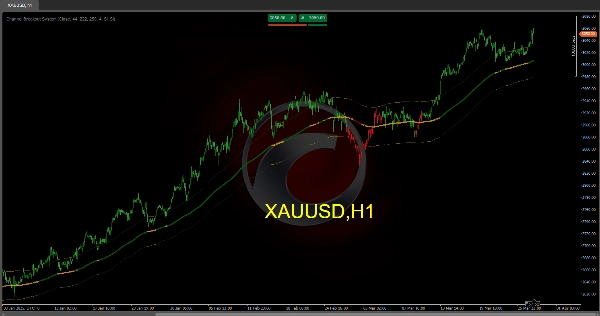
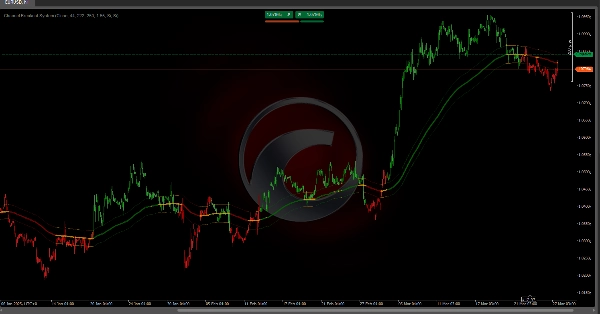
🎯 图表上的表现
🔵 主趋势线: 根据市场方向变色(绿色、红色或橙色)。
📏 虚线通道: 反映基于波动率的市场区间。
📊 彩色柱状: 直观显示当前市场阶段。
🚀 为什么使用此系统?
✔ 快速识别 市场是趋势还是区间。
✔ 直观突出显示 趋势强度和方向。
✔ 预判潜在反转,通过清晰的突破和交叉信号。
✔ 确认进出点,减少错误信号,提高交易准确性。
🔹 使用通道突破系统优化交易,更加自信地操作 🏆。准备好捕捉最佳市场机会! 📈🔥
Ctrader 商店指标:
摘要
指标配置
客户评价
4.3
评价:3
5 | 33 % | |
4 | 67 % | |
3 | 0 % | |
2 | 0 % | |
1 | 0 % |
客户评价
April 7, 2025
two sessions say more than one clean chart, and the trade does not rely on one glance.
March 29, 2025
Ngl, breaks are easier to judge and that is enough to keep testing it. A 5 minute check should not become a 30 minute rabbit hole.
March 28, 2025
A small signal sample gives a cleaner read, and the decision feels less rushed.
讨论
常见问答
Signal
Breakout
Supertrend
RSI
ATR
cTrader Store 提供的所有产品,包括交易机器人、指标和插件,均由第三方开发者提供,仅供信息参考和技术访问之用。cTrader Store 并非经纪商,不提供投资建议、个人推荐或任何未来业绩保证。


猜您喜欢


!["Gaussian Channel [Iridio Capital]" 标识](https://cdn.ctrader.com/image/webp/7c039209-5573-4a54-a072-f9528b503103_41960)
!["[Stellar Strategies] MARSI Signal Plotter" 标识](https://cdn.ctrader.com/image/webp/7b2b8da6-8f8e-4646-8d4a-4710c516c01e_25567)

价格
注册日期 03/10/2024
163
销售
37.79K
免费安装