
说明
🚀 超过10,000名交易者已经在使用我们的顶级 指标🏆
了解为什么专业人士选择我们——最强大的工具 cTrader(指标、算法和cBots)正等着您。
👉 在这里获取我们所有的顶级系统:
_______________________________________________
📌 市场结构指标
· ✅ 高级市场结构:Bos、Choch、SwinLevels、订单区块, 市场结构及流动性发现器
· 🔄 动态市场结构转折点分析
· 🧱 订单区块
· ⚖️ 市场失衡
· ⛓️ BOS & CHOCH
· 🧠 ICT 三力合一
· 🌀 市场极性区
_______________________________________________
🔚 智能退出系统
· 📍 跟踪智能算法
_______________________________________________
📐 之字形指标
· 🔍 之字形价格流动性投影
· 🧭 支撑与阻力结构之字形
· ➖ 之字形
· 🎯 之字形极限追踪器
_______________________________________________
🧱 支撑与阻力指标
· 🟩 智能趋势支撑与阻力线
· 🧱 所有支撑和阻力水平
_______________________________________________
📊 趋势与通道指标
· 🔄 自动趋势通道
· 📊 超级趋势
· ⚡动量趋势分析器
· 🧠 自适应趋势通道
· 💥 通道突破系统
· 🌈 动态趋势渐变
· ⭐ 高级SSL通道
· 🔁 反应性移动平均线
_______________________________________________
💧 成交量与流动性工具
· 🔥 成交量POC热力图
· 📉 杠杆清算图
· 🔍 动量公平价值缺口
· 🕒 公平价值缺口时段
_______________________________________________
⚡ 动量与RSI指标
· 📈 RSI趋势触发器
· 🚀 动态范围动量
· 🔎 多层蜡烛偏向
追踪器
_______________________________________________
🔮 预测与投影工具
· 📐 基于线性回归与ATR的预测
· 📏 斐波那契线性回归多时间框架
· 📈 基于成交量的市场流动投影仪
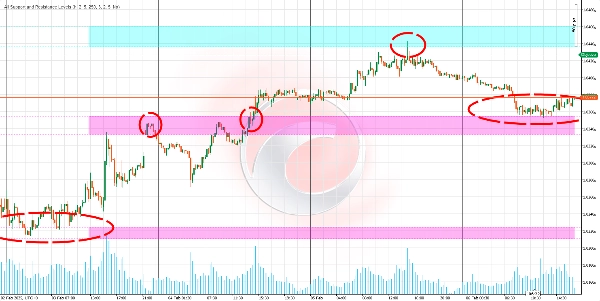
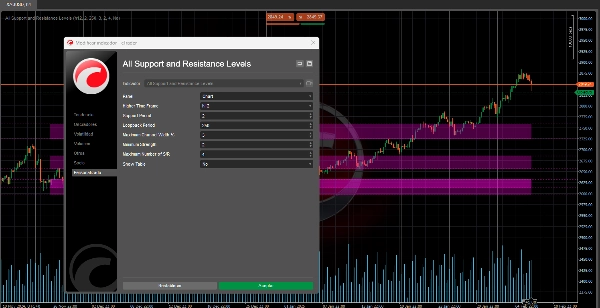
该算法是一款先进的支撑与阻力指标,旨在帮助您识别市场中的关键水平。
其主要优势在于允许您直接在所分析的图表上查看任何时间框架(如日线、周线或月线)的支撑与阻力水平,即使该图表处于不同时间框架(例如15分钟或1小时)。📊⏰
它的用途是什么?🎯
识别关键市场区域:
- 检测价格可能停止、反弹或强势突破的水平。🛑↗️↘️
- 帮助您做出更明智的入场、退出和止损决策。💡📈📉
无需切换图表即可分析多个时间框架:
- 在低时间框架(如15分钟或1小时)交易时,查看高时间框架(如日线或周线)的重要水平。🕒📅
- 让您无需频繁切换图表即可获得更广阔的市场视角。🌍🔍
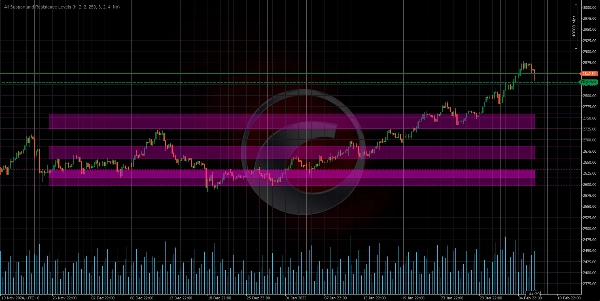
优先考虑重要水平:
- 指标根据“强度”对支撑和阻力水平进行排名,意味着价格过去与这些水平互动的频率。💪📊
- 这帮助您专注于最相关和最可靠的水平。🎯✅
逻辑是如何运作的?🧠⚙️
数据收集:
- 指标获取特定时间框架(日线、周线等)的最高价和最低价。📈📉
- 这些数据用于搜索价格行为中的关键模式。🔍📊
关键点(枢轴点)检测:
- 识别局部高点和低点——价格相较于附近价格达到峰值或谷值的点。⛰️🌄
- 这些点是成为支撑或阻力水平的候选者。🎯📌
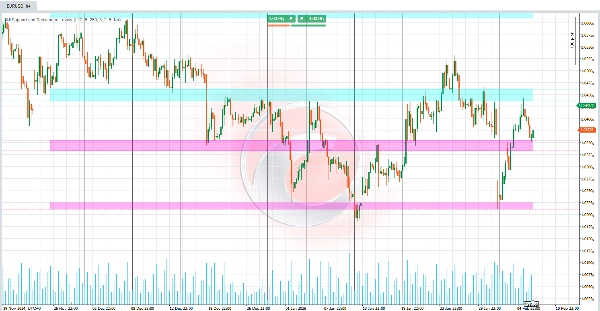
水平分组:
- 将附近的水平分组形成支撑或阻力区,而非精确线条。🟦🟧
- 这反映了支撑和阻力是区域而非精确点的理念。📏🎯
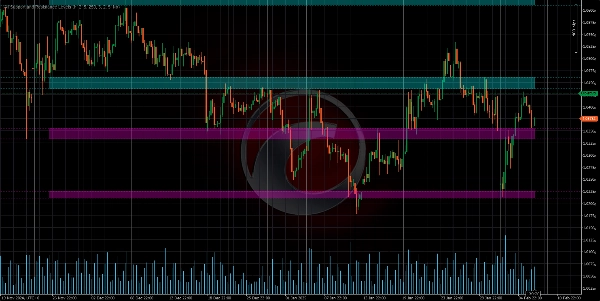
水平强度计算:
“强度”由两个因素决定:
- 触及频率: 价格过去触及或接近该水平的次数。🔄📊
- 关键点聚集: 该水平附近的高点或低点数量。🔗📈
强度更大的水平被视为更重要。💪🎯
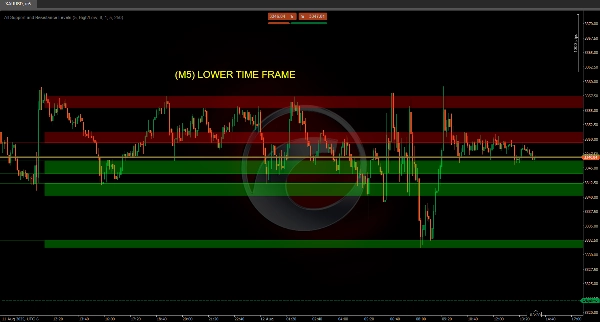
图表可视化:
- 水平以水平线或彩色区域绘制在图表上。🎨📊
- 每个水平的颜色取决于当前价格位置:
-
- 阻力: 如果价格低于该水平。🔴
- 支撑: 如果价格高于该水平。🟢
- 区间内: 如果价格处于该水平的范围内。🟡
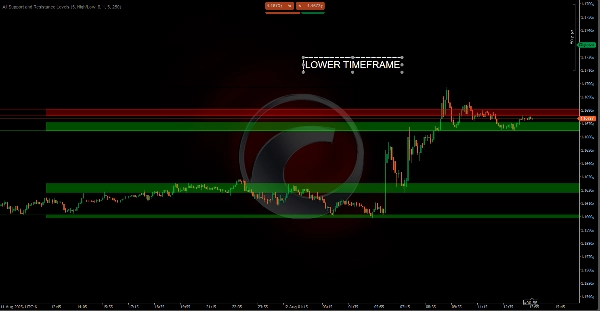
如何在图表上查看不同时间框架?🕒📊
在低时间框架图表上显示高时间框架的支撑与阻力:
- 例如,如果您正在分析15分钟图表,指标可以显示日线或周线的关键水平。🕒📅
- 这让您无需离开当前图表即可看到重要的高阶背景水平。🌍🔍
在高时间框架图表上显示低时间框架的支撑与阻力:
- 虽然较少见,您也可以在高时间框架图表(如日线或周线)上查看较小时间框架(如1分钟或5分钟)的水平。🕒📅
- 这对于在更广泛背景下进行更详细的分析非常有用。🔍📊
摘要
The indicator analyzes price data by collecting highs and lows from specified timeframes, identifying local pivot points where price peaks or valleys occur. These points are grouped into zones representing support or resistance areas rather than precise lines. Each level is assigned a strength score based on the frequency of price touches and the clustering of key points, helping users prioritize the most significant and reliable levels.
Visualized on the chart as horizontal lines or colored zones, the indicator uses color coding to indicate the price's position relative to each level: red for resistance (price below level), green for support (price above level), and yellow when price is within the level’s range. This tool assists traders in making informed decisions on entries, exits, and stop-loss placements by highlighting where price may stop, bounce, or break with strength.
客户评价
5 | 50 % | |
4 | 0 % | |
3 | 0 % | |
2 | 0 % | |
1 | 50 % |


!["[Stellar Strategies] MARSI Signal Plotter" 标识](https://cdn.ctrader.com/image/webp/7b2b8da6-8f8e-4646-8d4a-4710c516c01e_25567)


