
Multi-Timeframe Market Levels
指标
10 购买
版本 1.0, Dec 2024
Windows 版、Mac 版
5.0
评价:1
说明
增强型支撑阻力指标
利用我们的增强型支撑阻力指标为cAlgo释放技术分析的力量。这个高级工具旨在帮助交易者识别和可视化交易图表上的关键支撑和阻力水平,提升决策能力和交易策略。
主要特点:
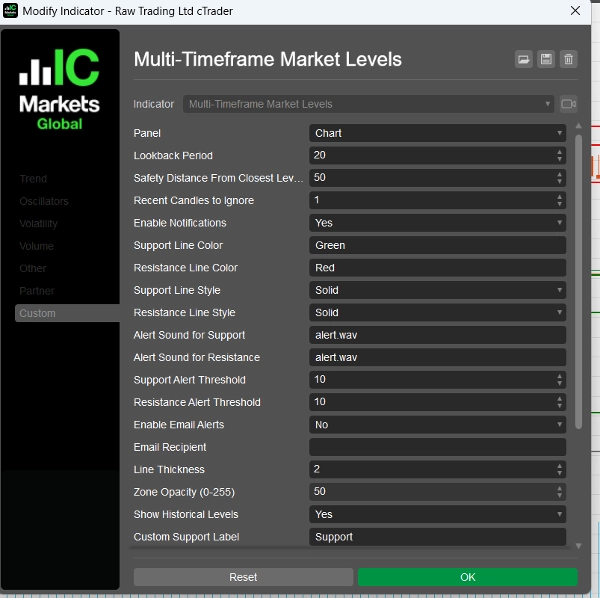
- 可定制参数:通过可调节的设置(包括回溯周期、安全距离、警报声音等)来调整指标以适应您的交易风格。
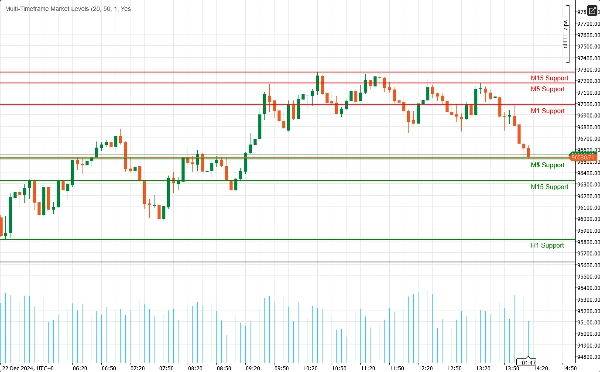
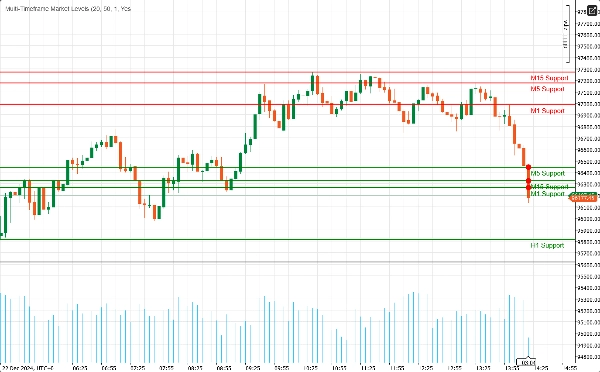
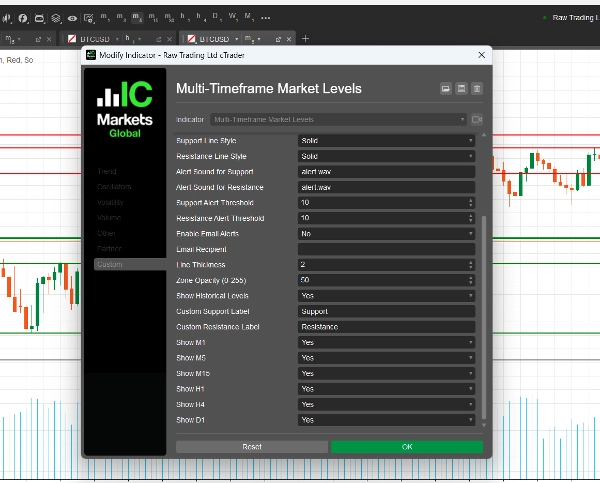
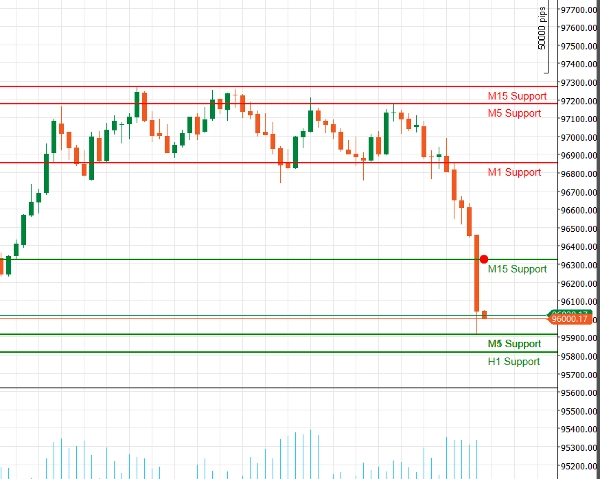
- 多时间框架支持:同时分析多个时间框架(M1、M5、M15、H1、H4、D1),全面了解市场动态,识别不同交易周期的关键水平。
- 实时警报:即时通知让您时刻掌握!当价格接近关键支撑或阻力水平时,指标可以发送音频警报和电子邮件通知,确保您不错过任何交易机会。
- 视觉清晰度:享受清晰的支撑和阻力水平视觉表现,配备可定制的颜色和线条样式。高亮区域提供额外的上下文,便于识别潜在的反转点。
- 斐波那契整合:通过内置的斐波那契水平绘制,增强您的分析,帮助识别潜在的回撤和扩展水平,与支撑和阻力结合使用。
- 用户友好界面:为新手和有经验的交易者设计,指标易于设置,并无缝集成到您现有的cAlgo环境中。
如何使用增强型支撑阻力指标
- 安装:
-
- 下载指标并导入到您的cAlgo平台。
- 将指标附加到您想要的图表上。
- 配置参数:
-
- 调整设置以适应您的交易风格。设置回溯周期、安全距离,并选择您喜欢的支撑和阻力水平的颜色和线条样式。
- 如果希望在价格接近这些水平时接收警报,请启用通知。
- 选择时间框架:
-
- 选择您想显示的时间框架。您可以根据交易策略选择显示或隐藏M1、M5、M15、H1、H4和D1的水平。
- 分析图表:
-
- 观察图表上绘制的支撑和阻力水平。这些水平表示价格可能反转或盘整的位置。
如何使用增强型支撑阻力指标进行交易
- 识别入场点:
-
- 多头交易:当价格接近支撑位时寻找买入机会,尤其是当出现反弹迹象(例如看涨蜡烛形态)时。
- 空头交易:当价格接近阻力位时考虑卖出,特别是当出现看跌信号(例如看跌蜡烛形态)时。
- 使用警报:
-
- 利用实时警报在价格接近关键支撑或阻力水平时通知您。这使您能够快速行动,抓住潜在的交易机会。
- 与其他指标结合使用:
-
- 通过将增强型支撑阻力指标与其他技术指标(例如移动平均线、RSI、MACD)结合使用,确认信号并提高交易准确性,增强您的策略。
- 设置止损和止盈水平:
-
- 在多头交易中将止损单设置在支撑位下方,在空头交易中将止损单设置在阻力位上方,以管理风险。
- 将止盈目标设置在下一个重要的支撑或阻力水平,以最大化潜在收益。
为什么选择增强型支撑阻力?
应对金融市场的复杂性可能充满挑战。 增强型支撑阻力指标为您提供识别关键价格水平和做出明智交易决策所需的工具。无论您是日内交易者还是长期投资者,这个指标都是您交易工具包中的必备利器。
摘要
AI 摘要
The Multi-Timeframe Market Levels indicator for cAlgo is an enhanced support and resistance tool designed to assist traders in identifying critical price levels across multiple timeframes. It supports simultaneous analysis of M1, M5, M15, H1, H4, and D1 charts, providing a comprehensive view of market dynamics. Key features include customizable parameters such as lookback periods, safety distances, alert sounds, and visual settings like colors and line styles for clear chart representation. The indicator integrates Fibonacci levels to identify potential retracement and extension zones alongside support and resistance. Real-time alerts via audio and email notify users when price approaches key levels, facilitating timely trading decisions. The user-friendly interface is suitable for both novice and experienced traders and integrates seamlessly into the cAlgo platform. Traders can use the indicator to identify entry points for long and short trades, set stop-loss and take-profit levels based on support and resistance, and combine it with other technical indicators like RSI and MACD for enhanced strategy accuracy. Installation involves importing the indicator into cAlgo and attaching it to desired charts, followed by parameter configuration and timeframe selection. This tool aids in visualizing potential reversal or consolidation zones to support informed trading decisions.
指标配置
客户评价
5.0
评价:1
5 | 100 % | |
4 | 0 % | |
3 | 0 % | |
2 | 0 % | |
1 | 0 % |
客户评价
August 18, 2025
Displays support/resistance levels from multiple timeframes in one chart. Clear visual hierarchy and flexible settings. Cons: No alerts or tooltips. Can't save presets or filter levels dynamically.
讨论
常见问答
RSI
MACD
cTrader Store 提供的所有产品,包括交易机器人、指标和插件,均由第三方开发者提供,仅供信息参考和技术访问之用。cTrader Store 并非经纪商,不提供投资建议、个人推荐或任何未来业绩保证。


猜您喜欢


价格
注册日期 22/11/2024
133
销售
2.57K
免费安装