
说明
QX Heatmap Scanner 是一个紧凑的图表内热力图面板,帮助您在几秒钟内扫描多个符号和时间框架。它将市场 方向、强度 和 波动性 汇总为清晰的每格评分,帮助您优先考虑最佳条件,避免低质量的设置。
您所看到的内容
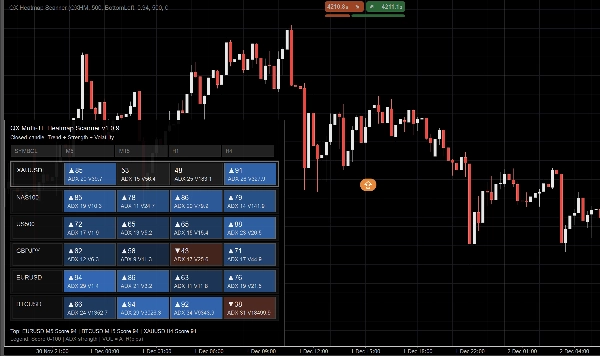
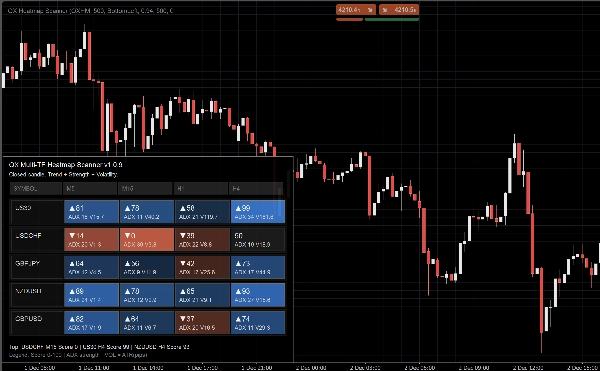
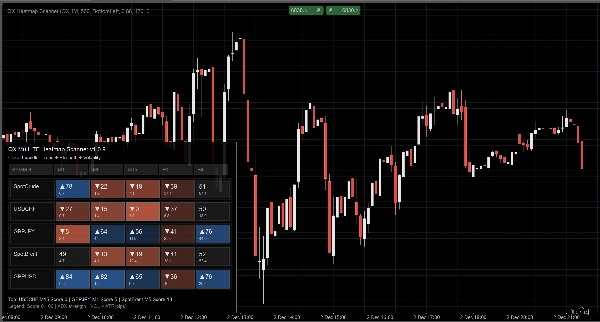
每个单元格(符号 × 时间框架)显示:
- 评分(0–100),带有方向标记(有偏时显示▲/▼)
- ADX 值(强度上下文)
- VOL 值(波动性上下文)
颜色强度反映信念。即使有多个时间框架,布局仍保持可读性。
显示模式
- 自动:适应可用单元格宽度
- 完整:最大细节显示
- 紧凑:优化以显示更多时间框架,同时保持ADX和VOL可见
- 极简:为小屏幕设计的超紧凑布局
它的帮助
- 在入场前更快的自上而下的市场背景了解
- 无需打开多个图表即可快速进行跨市场比较
- 通过突出显示更强的条件,实现更清晰的决策
性能与稳定性
- 设计为在 收盘蜡烛 时更新,以获得更清晰的信号和更低的噪音
- 更新节流(毫秒) 用于控制CPU使用率
- 对缺失符号或数据不足的防御性处理
主要功能
- 多符号、多时间框架热力图面板
- 每格评分0–100,带有明确的方向提示
- 持续显示ADX和VOL
- 可调节面板角落、宽度、不透明度和字体
- 颜色自定义(牛市/熊市/中性 + 强度范围)
关键参数
符号(CSV),时间框架(CSV),显示密度,面板宽度/角落/不透明度,显示VOL,字体大小,更新节流。
注意: 此工具提供市场背景。它不是自动交易系统,也不能替代风险管理。
摘要
AI 摘要
QX Heatmap Scanner is an on-chart indicator panel designed for multi-symbol and multi-timeframe market analysis. It provides a heatmap view that scores each symbol and timeframe combination from 0 to 100, reflecting market direction, strength, and volatility. Each cell displays a directional marker (up or down), ADX value for trend strength, and volatility (VOL) value, with color intensity indicating conviction level.
The panel supports various display modes—Auto, Full, Compact, and Minimal—allowing customization for different screen sizes and detail preferences. Users can adjust panel position, width, opacity, fonts, and color schemes for bullish, bearish, and neutral conditions.
QX Heatmap Scanner updates on closed candles to reduce noise and includes an update throttle feature to manage CPU usage. It handles missing symbols or insufficient data defensively to maintain stability.
Key features include quick top-down market context, cross-market comparison without multiple charts, and highlighting of stronger trading conditions. It supports symbols such as BTCUSD, EURUSD, GBPUSD, and markets including Forex, Crypto, Stocks, Commodities, and Indices. Parameters like symbols, timeframes, display density, and update throttle are user-configurable.
This tool provides market context to assist decision-making but does not execute trades or replace risk management.
指标配置
客户评价
4.3
评价:3
5 | 33 % | |
4 | 67 % | |
3 | 0 % | |
2 | 0 % | |
1 | 0 % |
客户评价
December 6, 2025
Patient market filter for traders who monitor several markets or signals. It gives value around market monitoring, but too much information can distract without a process. It saves time if daily review drops from 15 minutes to under 10. The value is speed and clarity, not a trade signal by itself.
December 5, 2025
December 5, 2025
Clear setup tool for market monitoring. it keeps useful information closer to the trader, especially when used for reviewing conditions without jumping between views. The dashboard style makes 10 minute reviews easier, especially when checking 5 to 8 markets. The value is speed and clarity, not a trade signal by itself.
讨论
常见问答
BTCUSD
Forex
Signal
Breakout
Indices
EURUSD
Commodities
GBPUSD
NZDUSD
RSI
Bollinger
Fibonacci
Scalping
Fair Value Gap
Crypto
Stocks
XAUUSD
NAS100
ATR
USDJPY
VWAP
cTrader Store 提供的所有产品,包括交易机器人、指标和插件,均由第三方开发者提供,仅供信息参考和技术访问之用。cTrader Store 并非经纪商,不提供投资建议、个人推荐或任何未来业绩保证。


价格
41.97M
交易量
208.53K
盈利点数
14
销售
362
免费安装