
说明
QX PivotZones 是一个为 真实交易决策 而构建的枢轴点指标,而不仅仅是价格忽略的静态线"
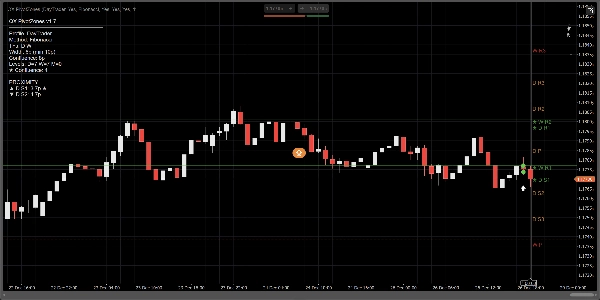
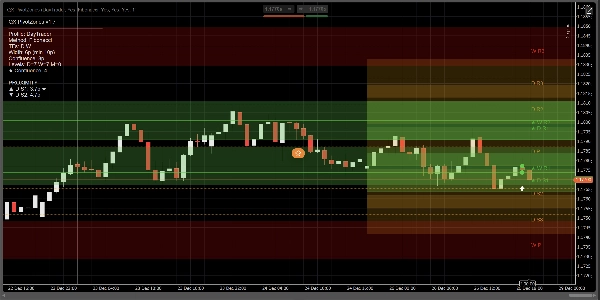
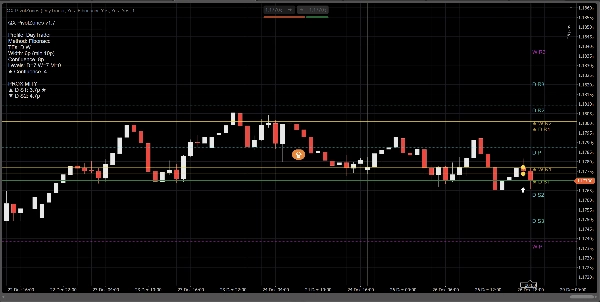
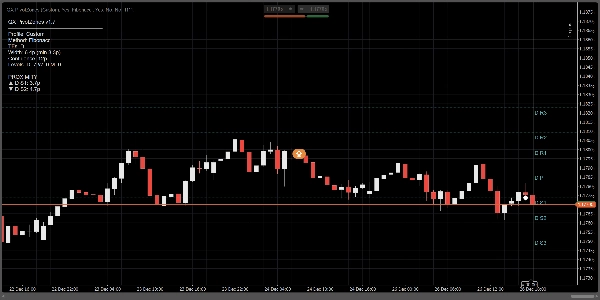
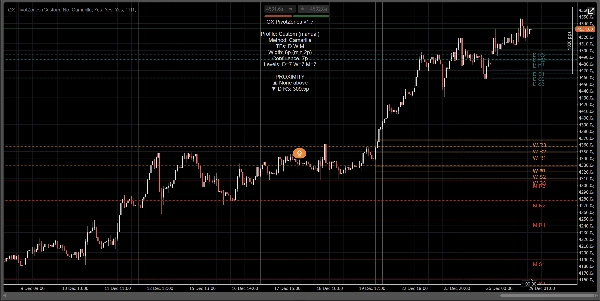
它计算 每日、每周和每月 枢轴点,使用 经典、斐波那契、Camarilla 或 Woodie 方法,并将它们绘制为 真实价格区间(带状区域),宽度可调(点数 或 基于ATR)。核心优势很简单:它自动突出显示 多时间框架的汇聚,并将枢轴点转变为 可操作区域,而非“完美线幻想”。
它与典型的斐波那契枢轴/斐波点工具的不同之处:
大多数“斐波点”指标仅停留在基本枢轴线。QX PivotZones 增加了交易者真正需要的功能:
- 自动日/周/月汇聚检测:当不同时间框架的枢轴点聚集时,该水平会被突出显示(★)并使用汇聚颜色绘制。
- 区间(带状区域)而非细线:以点数或ATR定义宽度。这减少了“几乎触及”反应的噪音。
- 最近水平过滤器(可选):仅显示当前价格上下最相关的区间。
- 实用警报:在 进入区间、触及线 或 两者 触发,带有冷却时间和可选的“仅汇聚”过滤。
- 信息面板 + 接近度:查看启用的时间框架、方法、区间宽度、汇聚计数,以及距离上下最近区间的距离。
使用方法:
1) 选择一个配置文件
- 短线交易者:日内,较少水平,更紧凑的自适应区间。
- 日内交易者:每日 + 每周(默认)。
- 波段交易者:每日 + 每周 + 每月。
- 自定义:手动控制所有设置。
提示:如果您想要“日内交易者 + 每月”,请禁用配置文件覆盖(或使用自定义)并手动启用 显示每月。
2) 配置区间(重点)
在 区间宽度模式 下:
- 点数 用于固定、一致的带状区域。
- ATR 用于波动率自适应带状区域。
关键参数:
- 区间宽度(点数) 或 ATR k
- 最小区间宽度(点数),避免带状区域过细
- 填充区间,用于绘制区间
- 向右延伸区间,将带状区域投射到可见的右侧
3) 启用汇聚(主要区别点)
- 高亮汇聚:开启
- 汇聚模式:
-
- 点数 用于固定容差
- ATR 用于自适应容差
- 汇聚距离 或 汇聚ATR k
汇聚水平获得:
- 汇聚颜色
- 标签上的★标记
- 面板中显示计数
4) 警报(无需盯着屏幕交易)
- 警报:进入区间、触及线或两者
- 警报:仅限汇聚:减少噪音
- 警报冷却时间(柱数):防止频繁触发
- 绘制警报图标:在图表上标记事件
快速设置预设(建议)
短线交易(M5–M15)
- 区间宽度模式: ATR
- ATR k: 0.15–0.25
- 汇聚模式: 点数
- 汇聚距离: 4–8 点
- 仅最近区间: 开启 (上方3个 / 下方3个)
日内交易(M15–H1)
- 区间宽度模式: 点数
- 宽度: 6–10 点
- 汇聚: 8–12 点
- 启用 每日 + 每周
波段交易(H4–D1)
- 区间宽度模式: ATR
- ATR k: 0.25–0.45
- 启用 每日 + 每周 + 每月
它的功能(和非功能)
- 这 不是 买卖信号生成器。
- 它是一个 市场结构 / 支撑阻力区间图,带有 事件警报(进入/触及)和 汇聚高亮。
- 最佳使用场景:枢轴点反应、拒绝/接受、回调、目标、分批出场和交易保护。
摘要
指标配置
客户评价
5.0
评价:1
5 | 100 % | |
4 | 0 % | |
3 | 0 % | |
2 | 0 % | |
1 | 0 % |
客户评价
December 29, 2025
tbh it is not magic, just a decent extra filter. It should not replace the chart.
讨论
常见问答
Signal
Indices
Commodities
GBPUSD
RSI
Bollinger
Fibonacci
Scalping
AI
XAUUSD
NAS100
MACD
BTCUSD
Forex
Breakout
EURUSD
NZDUSD
Prop
ZigZag
Supertrend
Fair Value Gap
SMC
Crypto
Grid
Stocks
ATR
USDJPY
VWAP
cTrader Store 提供的所有产品,包括交易机器人、指标和插件,均由第三方开发者提供,仅供信息参考和技术访问之用。cTrader Store 并非经纪商,不提供投资建议、个人推荐或任何未来业绩保证。


价格
41.97M
交易量
208.53K
盈利点数
13
销售
361
免费安装