
说明
QX SmartStructure (QX SS)
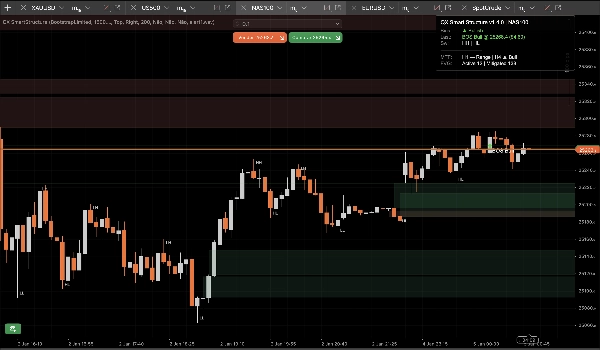
QX SmartStructure (QX SS) 是一个轻量级的、硬右边缘的 SMC 覆盖工具,适用于 cTrader。它显示当前结构、BOS/CHoCH 突破、过滤和自动管理的 FVG 区域,以及一个紧凑的 H1/H4 多时间框架偏向面板,让你停止频繁切换时间框架。
仅为可视化工具。不执行交易。
显示内容
1) 清晰的市场结构(硬右边缘)
- 摆动标签: HH / HL / LH / LL
- 关键水平: 最后确认的摆动高点 和 最后确认的摆动低点
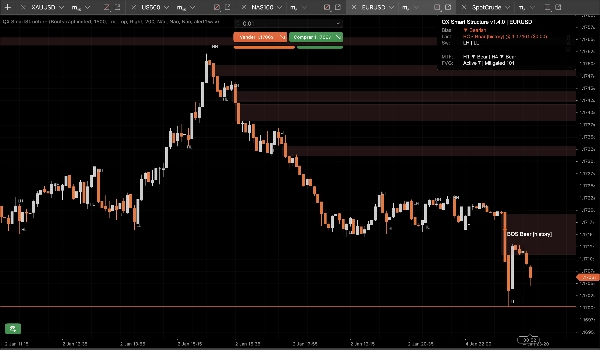
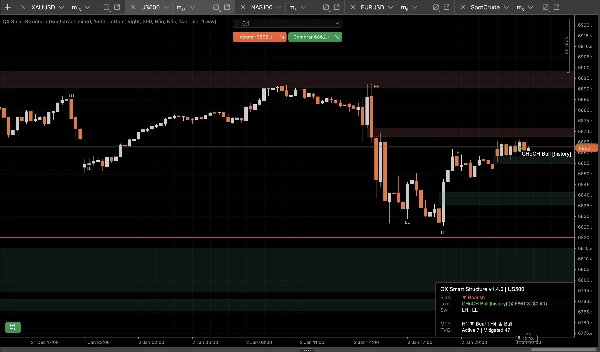
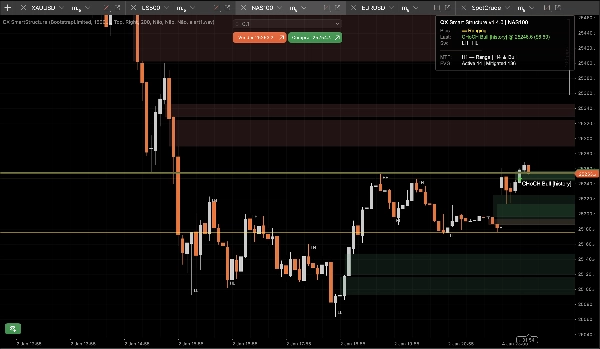
- 突破事件: BOS / CHoCH 带有强度(强 vs 弱)
- 显示模式:
-
- 仅活动 (最小化)
- 最近摆动 (受控上下文)
2) 受控的 FVG 区域
- 看涨和看跌 FVG 矩形
- 最小 FVG 大小(步数) 过滤器自动移除微小缺口
- 50% 缓解规则(基于影线): 当价格达到区域一半水平时,该区域被视为缓解
- 生命周期:
-
- 自动隐藏缓解 = 开启 以保持图表整洁
- 关闭 将缓解区域保留为“幽灵”上下文(较低透明度)
- 硬性上限防止长时间会话中对象泛滥(存储/绘制/向右延伸)
3) 多时间框架偏向面板(H1 / H4)
一个紧凑的面板显示:
- 当前时间框架偏向: 看涨 / 看跌 / 区间 / 未知
- 最后事件: BOS/CHoCH,方向,强度
- 可选快照: H1 偏向 和 H4 偏向
4) 可选声音提醒
仅声音提醒突破,具有:
- 可选 弱突破提醒
- 自定义声音文件名
步长优势(外汇、黄金、指数)
大多数结构工具在切换品种时会失效,因为它们假设“点数”在任何地方都意味着相同的东西。
QX SS 使用 步长 作为通用单位: TickSize → PipSize → 数字回退
将任意距离转换为步数
步数 = 价格距离 ÷ TickSize
示例(常见 TickSize):
- EURUSD TickSize 0.00001: 1 点 (0.00010) = 10 步
- XAUUSD TickSize 0.01: $0.10 = 10 步, $1.00 = 100 步
- 指数因经纪商而异:
在哪里找到 TickSize
- 在 cTrader Automate 中: Symbol.TickSize (QX SS 安全读取)
- 在平台界面:品种规格面板(市场观察品种信息)
推荐的最小 FVG 大小(步数)
这些是实用的起始范围,不是普遍真理。波动性和交易时段很重要。
M15(默认工作流程)
- EURUSD: 20–40 步(≈ 2–4 点,如果 TickSize = 0.00001)
- XAUUSD: 30–120 步(≈ $0.30–$1.20,如果 TickSize = 0.01)
- US500 / NAS100: 选择一个有意义的点数变动,然后转换:
M5(是的,会变化)
M5 会产生更多微小缺口。如果保持相同的最小 FVG 步数,你会过滤掉太多。
典型调整: 将最小 FVG 步数减少约 30–50% 相对于你的 M15 数值,然后重新调整。
“区间震荡”不是错误!
当最近的摆动高点/低点不清晰地排列为 HH+HL 或 LH+LL时,偏向变为 区间震荡。
在震荡市中,一个永远显示“看涨”的工具是在说谎。QX SS 设计上是保守的。
预设(起始点)
预设 A:“M15 平衡”(推荐默认)
- 摆动强度(M15=7): 7
- 突破类型: 收盘价
- 仅确认: 是
- 显示模式: 最近摆动
- 最近摆动计数: 30
- 最小 FVG 大小(步数): EURUSD 25 | XAUUSD 60 | 指数 15 (然后调整)
- 自动隐藏缓解: 是
- 最大绘制 FVG: 30
- 向右延伸条数: 50
- 显示多时间框架 H1: 是
- 显示多时间框架 H4: 是
预设 B:“M15 清洁图表”
- 显示模式: 仅活动
- 显示摆动标签: 否
- 自动隐藏缓解: 是
- 最大绘制 FVG: 15–20
- (其余保持预设 A)
预设 C:“M5 剥头皮上下文”
- 摆动强度: 5–6
- 突破类型: 任意
- 仅确认: 是 (开始严格)
- 显示弱突破: 否
- 最小 FVG 大小(步数): 约 50–70% 基于你的 M15 数值
- 最近摆动计数: 20–30
- 向右延伸条数: 30–50
cBot / 自动化集成(QX SS 暴露的内容)
QX SmartStructure 为 cBot 暴露了 3 个内部序列:
- 偏向序列: 1 表示看涨,-1 表示看跌,0 表示其他
- 突破信号序列: 1 表示多头突破,-1 表示空头突破,0 表示其他
- 突破水平序列: 事件柱的价格水平, 否则为 NaN (清晰哨兵)
稳定性和性能(v1.5.1+)
为多图表设置和长时间会话设计:
- 仅在 新闭合的柱子上处理
- 界面更新由 UI 节流(毫秒) 控制,以保持 CPU 低负载
- 受控对象数量和修剪上限防止图表泛滥
- 安全检测真正的“硬重载”(时间框架/品种/历史重载)并无漂移地重建状态
新安全选项(v1.5.1+)
跳空跳跃时失效(默认开启)
如果价格跳空并且 跳过一个 FVG 区域而未触及 (周末/新闻开盘),该区域将被标记为 跳空失效,而不是保持激活状态。
这防止了剧烈开盘后陈旧区域残留在图表上。
重建时完全清除序列(默认关闭)
在硬重建时,可选择清除暴露的输出序列的整个历史,以实现最大回测/导出一致性。
保持 关闭 以获得庞大历史上的最佳性能。仅在需要完整历史完整性的深度回测工作流程中开启。
推荐默认值
- 跳空跳跃时失效: 是(开启)
- 重建时完全清除序列: 否(关闭)
免责声明
此工具仅用于可视化和决策支持。交易有风险。请始终使用您自己的风险管理。
摘要
It automatically detects and manages Fair Value Gap (FVG) zones, filtering out micro-gaps based on a configurable minimum size measured in steps, a universal unit derived from the symbol’s TickSize. The indicator applies a 50% mitigation rule to mark zones as mitigated when price reaches their midpoint, with options to auto-hide or display mitigated zones as ghosted.
QX SmartStructure includes a compact multi-timeframe (MTF) bias panel showing current timeframe bias (Bullish, Bearish, Ranging, or Unknown) and recent break events for H1 and H4 timeframes. Optional sound alerts notify users of break events, including weak breaks.
The tool supports various markets such as Forex, commodities (e.g., gold), indices, and cryptocurrencies by adapting to symbol-specific TickSize values. It exposes internal data series for integration with cBots and is optimized for performance with controlled object counts and throttled updates. The indicator does not place trades and is intended for decision support only.
客户评价
5 | 100 % | |
4 | 0 % | |
3 | 0 % | |
2 | 0 % | |
1 | 0 % |


