
🎯 多时间框架波动率智能
别再错过波动率突破——同时查看所有时间框架
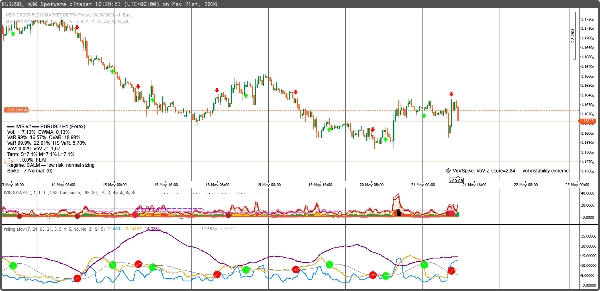
大多数波动率指标只显示一个视角。我们的 多时间框架滚动波动率指标 为您提供短期(7)、中期(21)和长期(63)周期的完整图景——配备 内置交易信号,准确告诉您何时行动。
⚡ 为什么多时间框架波动率改变一切
单一时间框架 vs 我们的多时间框架方法:
- ❌ 单一周期:只见树木,未见森林
- ✅ 三个周期:带有背景的完整波动率全景
真实交易场景:
- 短期波动激增 而长期平静 → 临时噪音(忽略)
- 所有时间框架波动上升 → 真正的市场状态变化(行动)
- 短期平静 而长期混乱 → 假象平静(谨慎)
🎯 专业功能
✨ 三重时间框架可视化
- StdDev 7:捕捉即时波动变化(盘中)
- StdDev 21:中期波动率(波段交易)
- StdDev 63:长期波动率背景(持仓交易)
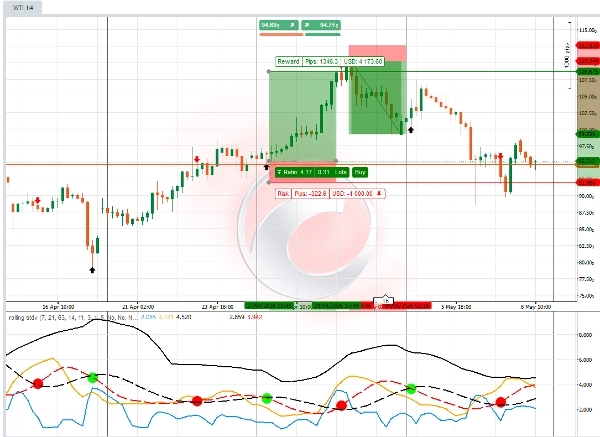
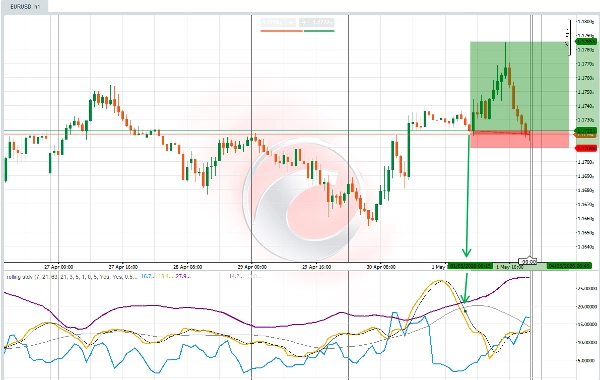
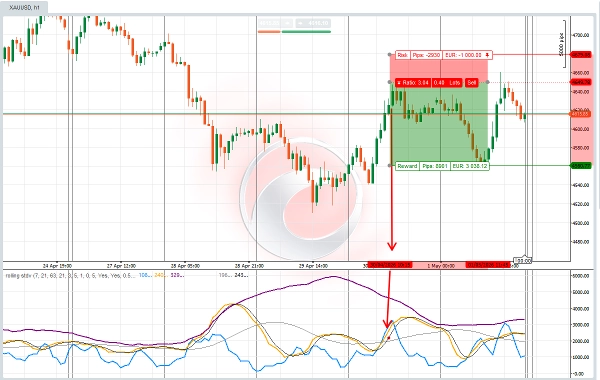
- 振荡器信号:当平均 滚动标准差信号线交叉时,彩色点确认更高和更低的波动率及价格走势方向。配合大型红点、绿点信号,交易者还将在图表上看到红箭头、绿箭头信号,帮助决定入场点位和交易规模。
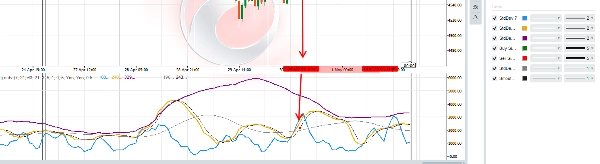
- 滚动标准差是一种带有预测市场信号逻辑的波动率振荡器。面板上的参数需根据交易者想交易的CFD工具类型进行检查和调整。每种金融资产CFD工具的面板设置可能略有不同。交易者可以通过激活:斜率、快/中交叉信号和平滑功能,选择波动率读数的准确性和精度。
📊 高级波动率分析
- 波动率交叉:StdDev线交叉 = 市场状态变化
- 均值回归信号:波动率回归均值
- 波动峰值检测:极端波动事件
💡 适合以下交易风格:
🎯 波动率突破交易者
- 在爆发性行情前低波动时入场
- 在高波动时出场,防止反转
- 使用三重确认精准把握入场时机
📈 均值回归交易者
- 自信地对冲波动极端
- 识别过度延伸的市场状况
- 将波动率用作逆向指标
🛡 风险规避型交易者
- 完全避免高波动期
- 仅在平稳、可预测的市场中交易
- 将波动率用作 仓位规模指导
📊 期权交易者
- 高波动时卖出时间价值
- 波动率压缩时买入期权
- 隐含波动率与历史波动率分析误价
内置智能信号:
- ✅ 买入时机:波动率低于阈值或跌破移动平均线时
- ✅ 卖出时机:波动率高于阈值或突破移动平均线时
📈 您将获得:
✅ 三重时间框架可视化 - 不再猜测波动率背景
✅ 自动买卖信号 - 最佳点位清晰箭头提示
✅ 波动率状态检测 - 了解市场何时平静或混乱
✅ 可定制阈值 - 适应任何交易风格或资产
✅ 专业颜色编码 - 即时视觉理解
💰 特别推出价:$50
(原价:$100)
价值明细:
- StdDev 7 指标:价值$29
- StdDev 21 指标:价值$29
- StdDev 63 指标:价值$29
- 交易信号:价值$49
- 总价值:$136
- 您的价格:$50(节省35%)
包含:完整指标 颜色
🎁 赠品:免费波动率时机指南
购买即赠送 “多时间框架波动率精通” - 价值$39,免费赠送。
包含内容:
- 波动率压缩交易策略
- 多时间框架确认技术
- 波动期风险管理
- 真实交易案例
🚀 准备好掌握波动率时机了吗?
点击“加入购物车”,改变您看待和交易市场波动率的方式。
“我尝试过所有波动率指标。这种带内置信号的三重时间框架方法是我在自营交易中每天使用的。”
- Sarah Rodriguez,专业波段交易员
适合以下市场:
📊 股票与ETF
- SPY、QQQ波动率时机
- 基于波动率的行业轮动
- 财报波动率交易
💹 外汇货币对
- 主要货币对波动率分析
- 套息交易风险评估
- 突破确认
📈 大宗商品
- 黄金波动周期
- 石油波动峰值
- 农产品季节性波动
🔄 加密货币
- BTC/ETH波动率状态
- 山寨币波动机会
- 加密货币风险管理
总结:这不仅仅是另一个标准差指标。这是一个完整的波动率时机系统,准确显示市场即将变动的时刻。
限时推出优惠:前150份售价$89(节省$30)
“业余与专业交易的区别往往在于波动率时机。这个指标弥补了这一差距。”
立即加入购物车 → 像专业人士一样开始交易波动率。
指标配置
指标分类
波动性
输出类型
信号
数据要求
跳动点数据
支持的信号
交叉
背离
波动性
反转
4.5
评价:2
5 | 50 % | |
4 | 50 % | |
3 | 0 % | |
2 | 0 % | |
1 | 0 % |
Volume
Moving Average
cTrader Store 提供的所有产品,包括交易机器人、指标和插件,均由第三方开发者提供,仅供信息参考和技术访问之用。cTrader Store 并非经纪商,不提供投资建议、个人推荐或任何未来业绩保证。
该作者的其他作品


猜您喜欢


42
销售
306
免费安装