说明
KNN 机器学习动量 停止落后。开始预测。机构级别的K近邻分析。
默认参数针对XAUUSD进行了优化。适用于任何时间框架——根据您的交易风格选择。较高的时间框架提供更干净、更高概率的信号。较低的时间框架生成更多信号,但噪音稍多。请参见下面的时间框架指南。
🥈 另有提供:XAGUSD自动化机器人版本 喜欢这个逻辑?更进一步。该指标的专用机器人版本——专门针对 XAGUSD(白银) 进行了微调——已在市场上架。它完全自动运行,代表您执行交易,无需手动输入。价格相对于其预期的投资回报率较低。
👉 KNN XAGUSD 机器人 — 在 cTrader 市场查看
⏱ 时间框架指南
时间框架信号量备注
M5
非常高
噪音较多——需要更严格的纪律和过滤以避免过度交易。
M8
高(默认)
优化的基线。XAUUSD信号频率与准确性的最佳平衡。
M15
中等
更干净、更高质量的信号,每个交易时段的入场次数较少。
M30 / H1
低
最高准确率——最适合需要更多耐心的波段交易设置。
默认参数是在M8上回测的。如果切换时间框架,建议相应调整ATR周期和止损/止盈倍数。
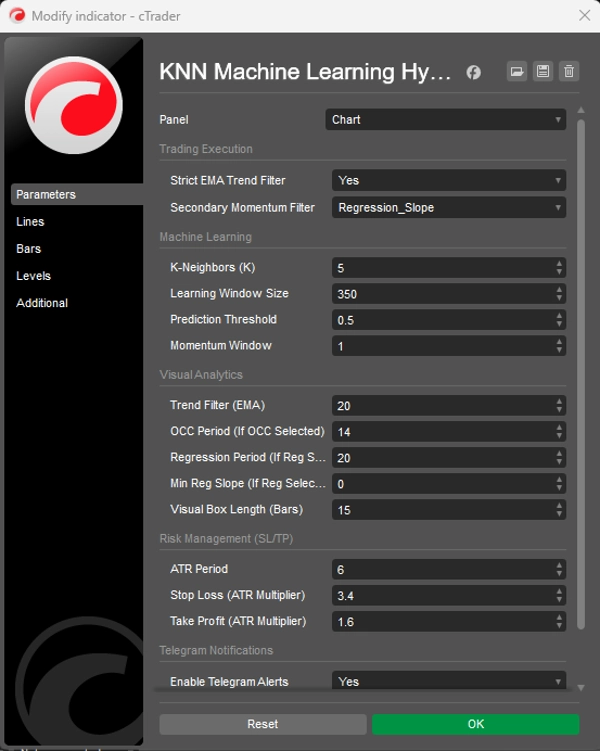
⚙️ 默认参数
学习窗口(350) — KNN引擎扫描的历史蜡烛数量以匹配模式。
预测阈值(0.5) — 生成信号前所需的最低置信度分数。
ATR周期(6) — 用于计算止损/止盈大小的平均真实波幅周期。
止损倍数(3.4) — 止损距离 = ATR × 3.4。较宽以给黄金的波动性留出空间。
止盈倍数(1.6) — 止盈距离 = ATR × 1.6。较紧以快速锁定利润并保持高胜率。
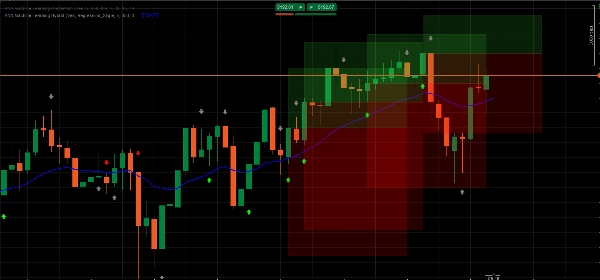
趋势过滤EMA(20) — 用作趋势过滤的EMA周期——图表上的蓝线。
🤖 预测KNN引擎 将RSI和MA偏差压缩成历史匹配算法。每根蜡烛,它扫描最近350根柱,找到5个最相似的过去时刻以预测方向。
📈 严格的EMA趋势过滤器 自动抑制低概率的逆势设置。只有与大趋势一致的信号才被标记为高概率。
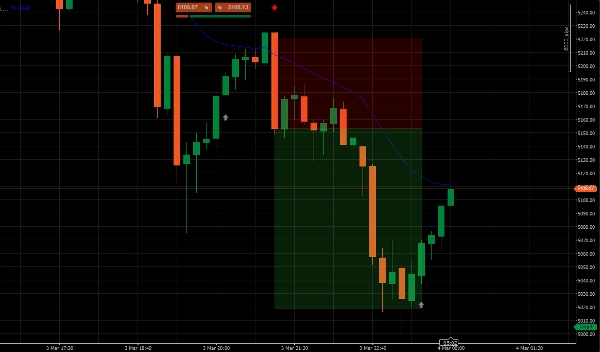
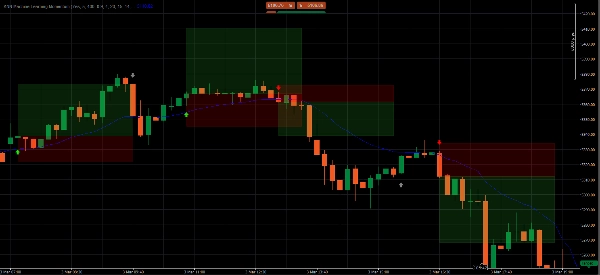
📦 动态ATR目标区 投射透明彩色框,表示您的止盈和止损区域,实时根据ATR适应当前市场波动性。
🧹 界面内存管理器 通过自动移除旧区域保持图表整洁。任何时候只显示最近5个设置。
📲 Telegram推送提醒 内置webhook集成,直接向您的手机发送包含精确入场、止盈和止损价格的即时交易提醒。
📊 信号解读
🟢 亮绿色箭头 — 高概率买入 KNN预测价格将上涨且价格位于EMA之上。完全趋势一致。这些是优质的交易设置。
🔴 亮红色箭头 — 高概率卖出 KNN预测价格将下跌且价格位于EMA之下。完全趋势一致。在信号蜡烛收盘时入场。
⚪ 灰色箭头 — 逆势(请勿交易) 检测到动量变化,但与大趋势相反。仅作为提醒打印——概率显著较低。
▶️ 执行指南
- 等待亮绿色或亮红色箭头——完全忽略灰色信号。
- 等待信号蜡烛完全收盘后再入场。
- 将止损和止盈设置在每个框的外侧水平边缘——距离入场价最远的边缘。
❓ 常见问题
为什么会出现箭头? 每根蜡烛,算法快照当前RSI和MA动量,扫描最近350根柱,找到5个数学上最相似的时刻,并基于这些时刻价格的走势预测方向。
亮箭头和灰箭头有什么区别? 亮箭头 = AI信号与EMA趋势完全一致——概率最高。灰箭头 = 检测到动量但逆势——标记为风险过高不宜交易。
我应该使用哪个时间框架? M8是优化的默认值。较高时间框架(M15、M30、H1)信号较少但更干净。M5信号更多但需要更严格的过滤纪律。
我应该把止损和止盈放在哪里? 放在每个彩色框的外侧水平边缘——距离入场价最远的边缘。
我可以在黄金以外的资产上使用此指标吗? 可以——适用于cTrader上的任何资产。但参数是针对XAUUSD专门回测的。其他品种需要进行参数调优。
⚠️ 风险声明 外汇、商品和差价合约保证金交易风险较高,可能不适合所有投资者。此指标仅为定量分析工具,用于教育和信息目的——不构成财务建议。过去表现不代表未来结果。请务必先在模拟账户测试,切勿直接使用真实资金。
摘要
Key functionalities include dynamic Average True Range (ATR)-based stop loss and take profit target zones that adapt to market volatility, and a UI memory manager that keeps charts clear by displaying only the five most recent setups. Signals are visually represented by arrows: bright green for high-probability buy, bright red for high-probability sell, and gray for counter-trend momentum (not recommended for trading). The indicator supports multiple timeframes, with M8 as the default optimized setting balancing signal frequency and accuracy.
Additionally, it integrates Telegram push alerts via webhook, delivering real-time trade signals with precise entry, stop loss, and take profit levels. Users are advised to wait for signal candle closure before entering trades and to place stops and targets at the edges of the ATR target zones. Parameters such as learning window, prediction threshold, ATR period, and multipliers for stop loss and take profit are configurable to suit different trading styles.